If you synchronize a parameter variation object to another one, the graphics settings are copied so that they are the same for both objects. However, size and position of the corresponding view objects are not synchronized automatically up to now. This missing feature has been implemented today.
Tag Archives: view
Bugfix view elements
After drag&drop of an integral quantity into the list of view elements the newly created view item lost its source after a “Duplicate” command. This has been fixed.
Improvements “Multiple spectra view”
Objects of type “Multiple spectra view” do their automatic scaling more clever now, taking into account all active spectra.
These view objects can now be selected by a single mouse click and then scaled using the controls in the status bar, like field view objects. Also the little buttons R (restore graphics), A (automatic scaling) and E (edit graphics parameters) work with these objects.
Bugfix: Dominant wavelength and purity in views
The appearance of objects of type “Dominant wavelength” and “Purity” in views could not be edited any more. We are sorry for this and have re-activated the option to change the display mode.
Working with a separate main view window
We are in middle of the transition to object generation 4.xx which will be delivered with a lot of useful program configurations (and a guide of the user to easily find what is needed). Some of the new configuration files come with explanations in the main view, telling the user what to do in the treeview.
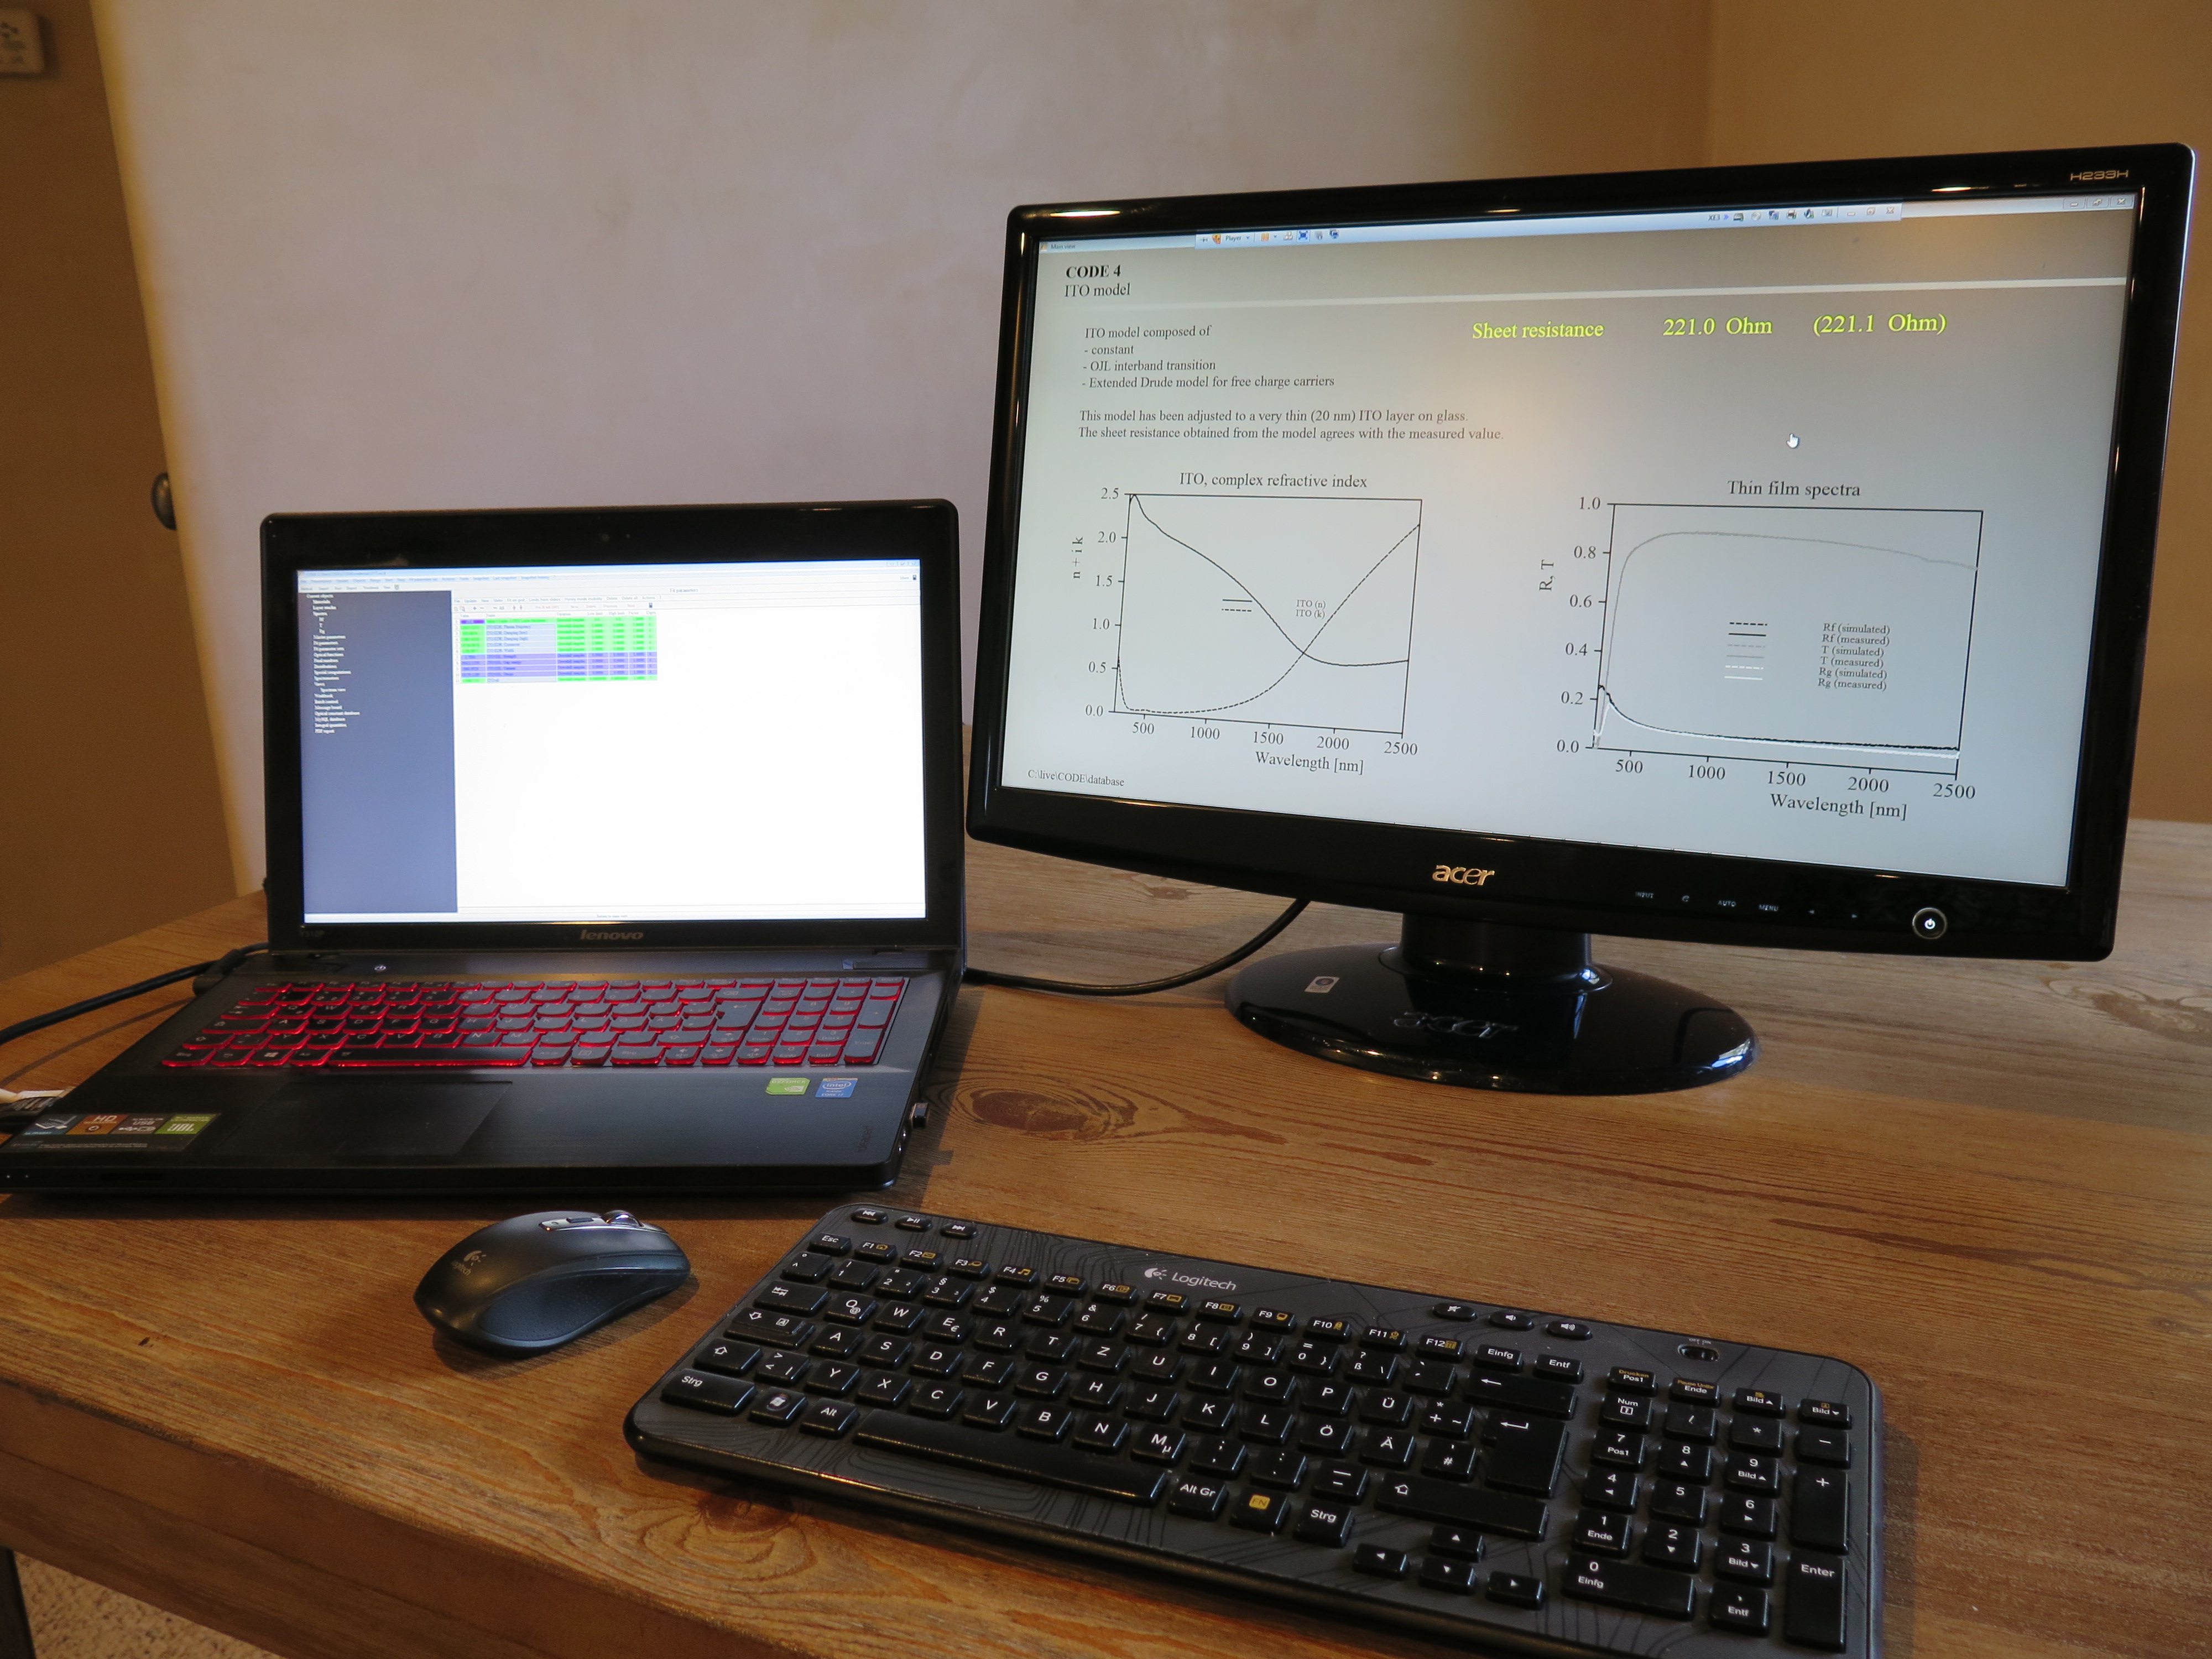
In order to efficiently work with such configurations it is useful to see both the main view and the treeview at the same time. This is now possible with the command ‘Actions/View/Open external view’ which opens a separate window showing the main view. Ideally you push this window to a second monitor (if you have one). Here is an example:
Angular color: New visualization
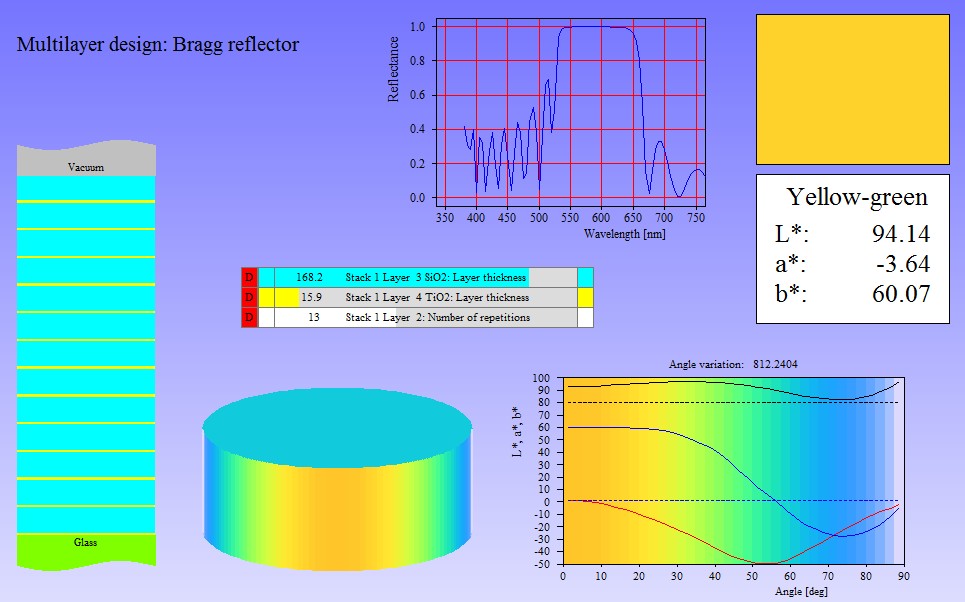
The angular dependence of the color of coatings can now be visualized in more ways. In addition to charts showing the variation of L*, a* and b* with angle you can now use a direct visualization of color in the main view.
You can introduce a colored background of the chart or show the appearance of a coated cylinder as shown in the example below. Like all view elements you have instant update if a parameter slider is moved.
New script commands
In order to realize some new user interface options in views, we have introduced some new script commands. The available commands are described here.
PDF export improved
Problems displaying some view elements (layer stack view, background, color gradients) in PDF documents have been removed.
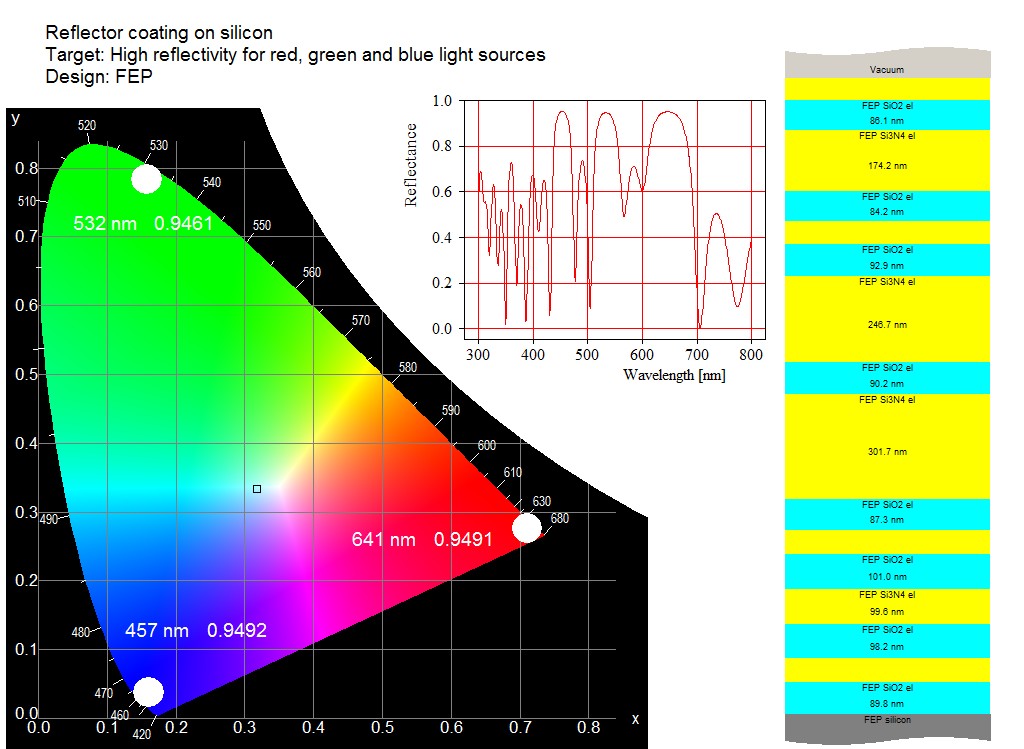
More flexible layer stack view
Introduced with object generation 3.97
Visualizing a layer stack in views is now more flexible. Instead of representing each layer as a rectangle of constant height (i.e. the same height for all layers) the graph can now better visualize the proportions by drawing the rectangles with heights proportional to the thickness of the layer.
The graphs below show the difference. Up to now layer stack views looked like this:
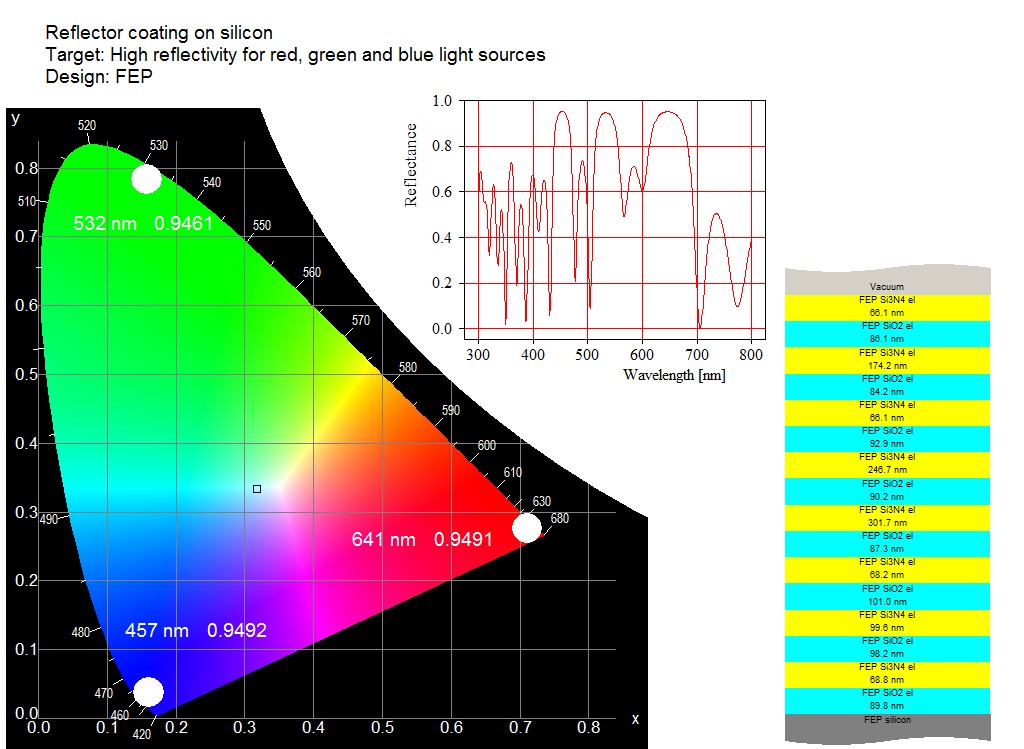
Now you can have this:
This kind of drawing makes it much easier to compare layer stacks:
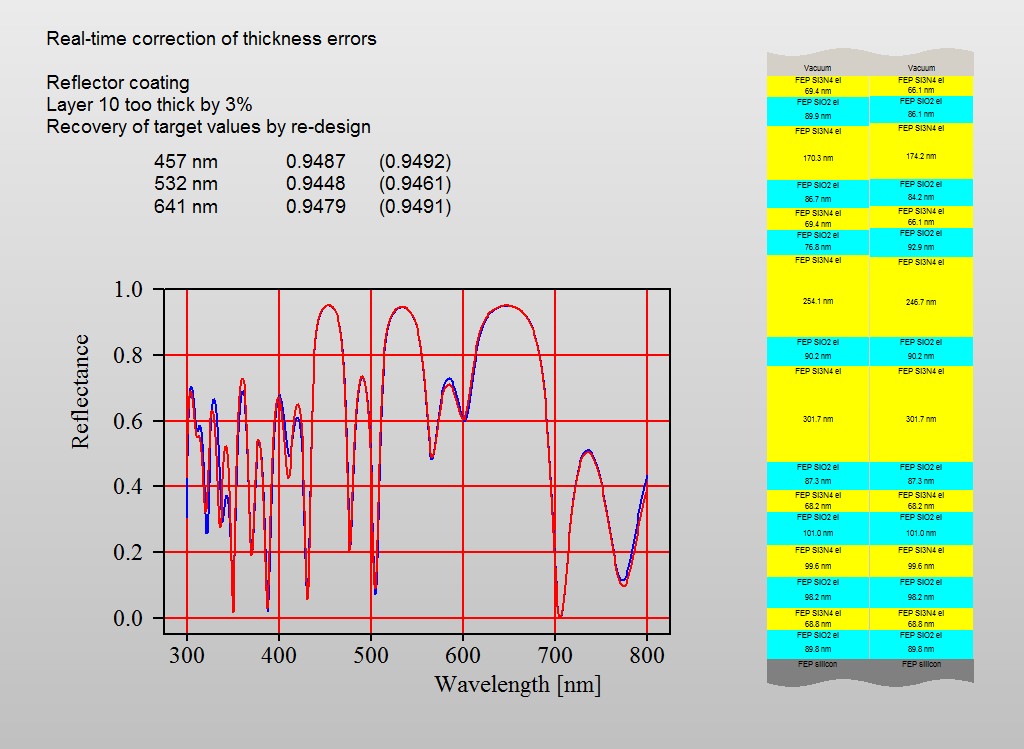
The new kind of drawing is activated by a click on the layer stack in the view. You will be asked for the thickness that the height of the base rectangle should represent. The value must be specified in micrometers – if you set a value to 0.075 the base rectangle shows 75 nm of the stack.
Since layer thickness values in stacks with thin films and (incoherent) thick layers are very different, it is not possible to see thick layers and thin films in one graph. Thin films with thicknesses 100000 times smaller than thick layers will simply not be visible (like in real life). If you still want to show the thin film part of the stack with the new feature you have to use 2 layer stacks: one for the thin film coating alone and the second one for the complete layer stack. In this case you have to insert the coating as ‘included layer stack’ in the second one.
Automatic graphics generation and ‘Range’ command
Bug fix in object generation 3.96
After execution of the ‘Range’ command in spectra and material objects the settings of the x-axis in the graph has been changed, ignoring the option ‘Automatic graphics generation’. This has been fixed – the axis labels remain unchanged.