How do I describe a gradient of optical constants?
A gradient of optical constants can be implemented in an optical model using the layer type ‘concentration gradient’.
The strategy is this:
Define an effective medium, i.e. a mixture of 2 materials, using one of the simple effective medium objects Bruggeman, Maxwell-Garnett or Looyenga. The best choice for gradients is Bruggeman, also known as EMA. The only parameter to describe the topology of the mixture is the volume fraction.
In the next step, insert a concentration gradient layer into the layer stack and assign the effective medium material to it. The gradient will be described by a user-defined function that defines the depth dependence of the volume fraction from the top of the layer to the bottom. Select the layer and use the Edit command to access the formula definition window.
Finally, you go back to the layer stack definition window and specify how many sublayers should be used to sample the gradient. Be careful not to take too many sublayers – this could increase the computational times a lot. On the other hand, be careful not too ‘undersample’ the gradient – if you increase the number of sublayers by 1 the spectra should not change significantly.
Please consult the manual for further details …
How do I describe surface roughness?
Roughness can be taken into account in different ways in optical models for thin films.
The easiest way is to replace the sharp interface between two materials by a thin layer with mixed optical constants. This is a good approach for roughness dimensions clearly below the light wavelength. Mixed optical constants can be computed using an effective medium model. The Bruggeman formula (also known as EMA – effective medium approximation) is a good choice (please read the remarks below). Start with a very thin intermediate layer (e.g. 2 nm) and select its thickness as fit parameter. The volume fraction of the effective medium model should be an adjustable fit parameter as well.
An advanced version of this kind of roughness modeling is to use a concentration gradient layer. This type of layer can describe a smooth transition between adjacent materials. The depth dependence of the volume fraction can be expressed by a user-defined formula with up to 6 parameters that can be fitted.
A warning must be raised using effective medium models to describe roughness effects. All effective medim models in our software are made for two phase composites which are isotropic in three dimensions. They are not valid for surface roughness effects. To apply these concepts anyway can be justified by saying that there is no reasonable alternative and that it is very common to do so …
Describing rough metal surfaces with an effective medium model may be a little tricky. This is especially true for silver. Inhomogeneous metal layers can be efficient absorbers with very special optical properties, and effective medium approaches can be very wrong – please read SCOUT tutorial 2 about this.
The roughness described by effective medium layers does not lead to light scattering but modifies the reflectance and transmittance properties of the interface between the adjacent materials. Light scattering at heavily rough interfaces can be taken into account in a phenomenological way in cases where the detection mechanism of the spectrometer system does not collect all the scattered radiation. You can introduce a layer of type ‘Rough interface’ which scales down the reflection and transmission coefficients for the electric field amplitude of the light wave. The loss function is a user- defined function which may contain 2 parameters C1 and C2 which are fit parameters. In addition, the symbol x in the formula represents the wavenumber.
The expression C1*EXP(-(X/C2)^2), for example, would describe an overall loss by a factor C1 and an additional frequency dependent loss which is large for small wavelengths and small for large wavelengths. This kind of approach has turned out to be satisfying in several cases.
The list of spectra in SCOUT and CODE offered object types called ‘Angle scan’ and ‘XRR’ for a long time already. Although the names indicate what these objects are made for, there was no documentation up to now. We have started to update the SCOUT help with respect to these objects.
Here are the links to the relevant sections:
Introduced with object generation 3.97
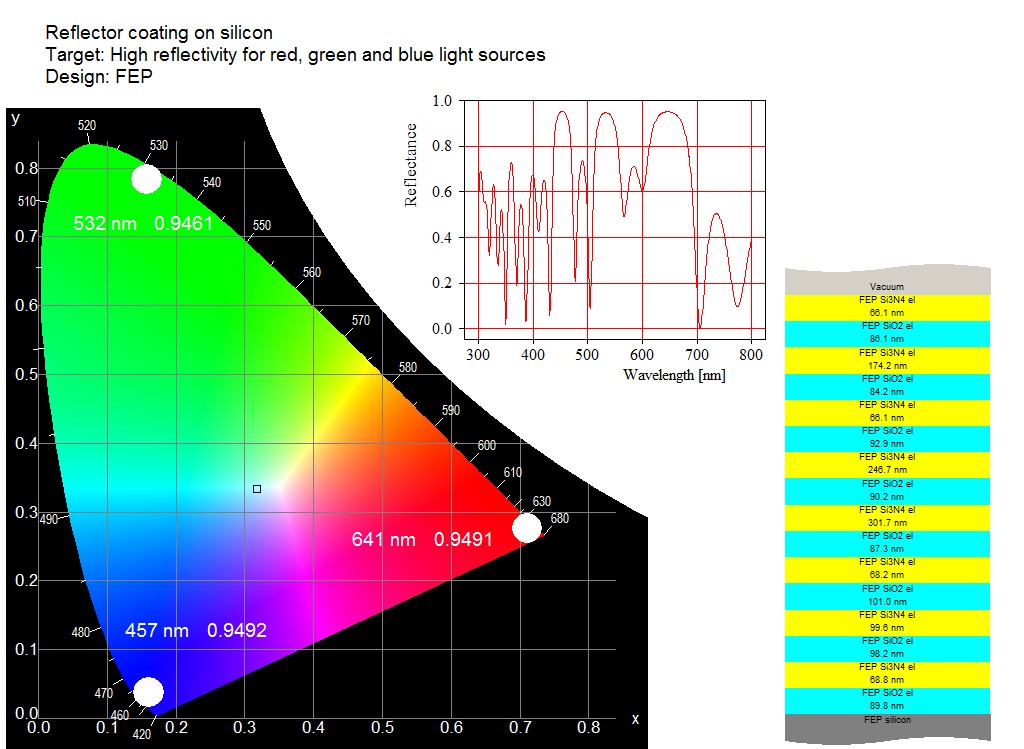
Visualizing a layer stack in views is now more flexible. Instead of representing each layer as a rectangle of constant height (i.e. the same height for all layers) the graph can now better visualize the proportions by drawing the rectangles with heights proportional to the thickness of the layer.
The graphs below show the difference. Up to now layer stack views looked like this:
Now you can have this:
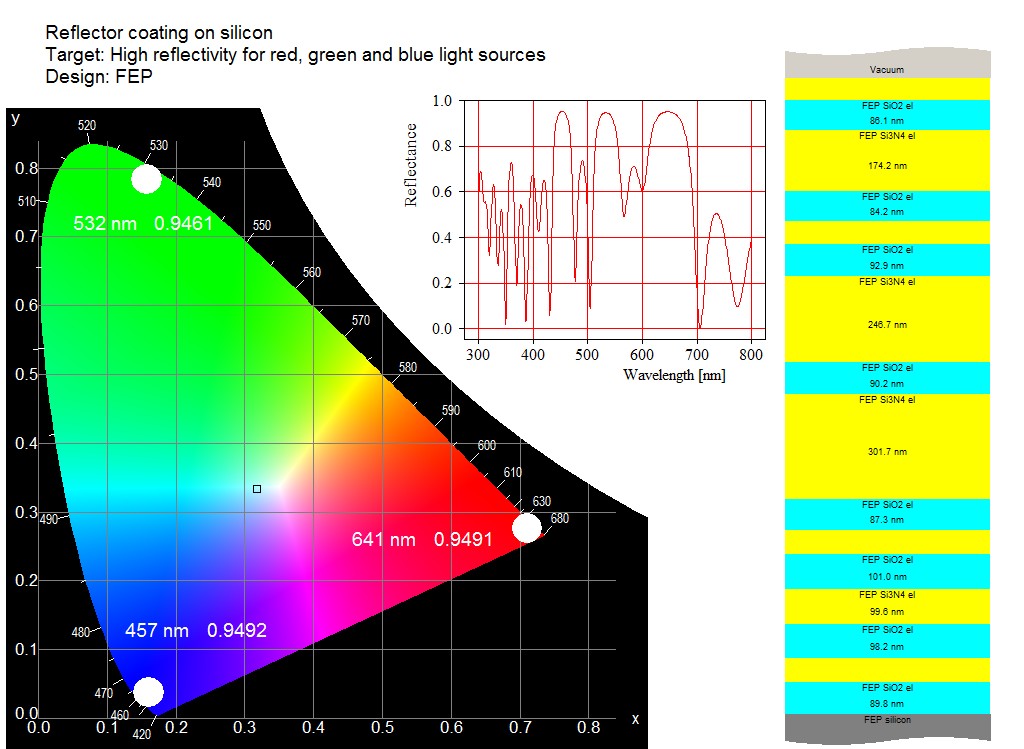
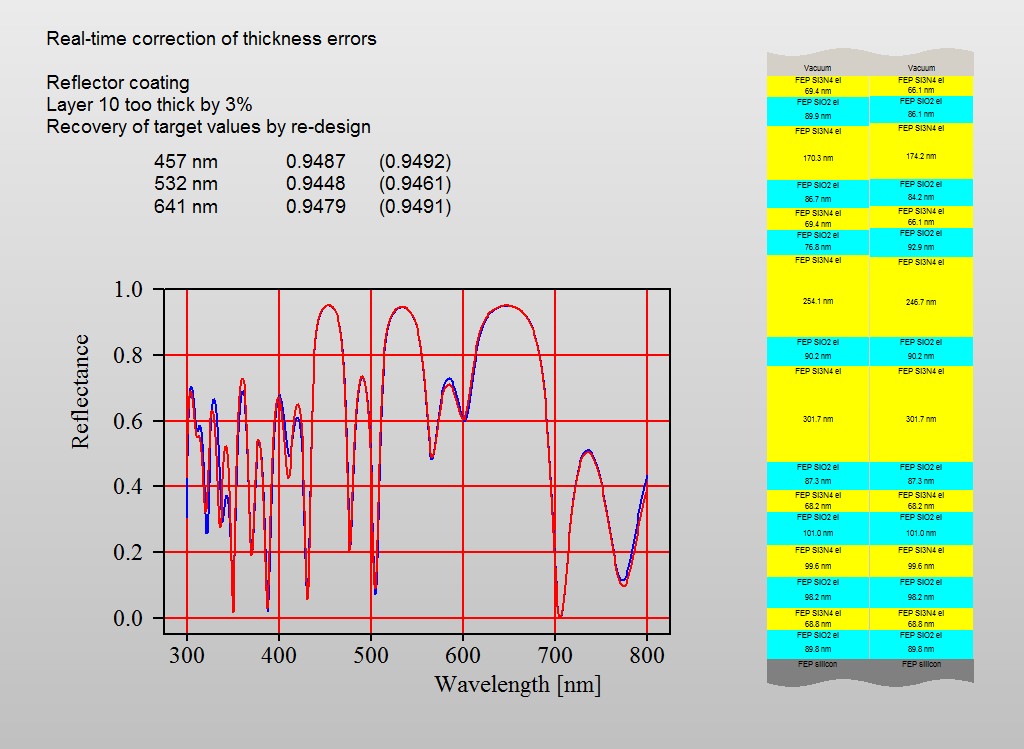
This kind of drawing makes it much easier to compare layer stacks:
The new kind of drawing is activated by a click on the layer stack in the view. You will be asked for the thickness that the height of the base rectangle should represent. The value must be specified in micrometers – if you set a value to 0.075 the base rectangle shows 75 nm of the stack.
Since layer thickness values in stacks with thin films and (incoherent) thick layers are very different, it is not possible to see thick layers and thin films in one graph. Thin films with thicknesses 100000 times smaller than thick layers will simply not be visible (like in real life). If you still want to show the thin film part of the stack with the new feature you have to use 2 layer stacks: one for the thin film coating alone and the second one for the complete layer stack. In this case you have to insert the coating as ‘included layer stack’ in the second one.
You can now use measured sheet resistance values for analysis of traverse data. This can significantly stabilize the fitting of silver based glass coatings, in particular if you fit both silver thickness and quality (using the Drude model damping constant).
In order to use sheet resistance values, you need to update VAAT_spectrum_scanner.exe, bright_eye_traverse.exe and the OLE server code.exe. All program files must be generated on August 29, 2014, or later.
Please read this as well: CODE link
Hardware and software for optical spectroscopy