The integral quantity “Color fluctuation” computes the variation of color in the case of thickness fluctuations of a layer stack. Up to now the size of the “Color cloud” is computed using distances in L*, a*, b* space. You have now the additional option to compute the distance in the a*,b* plane only, neglecting fluctuations for L*.
In addition, we have removed a bug in the computation: Be aware that the values computed with the new version are different from the ones calculated with previous versions – sorry!
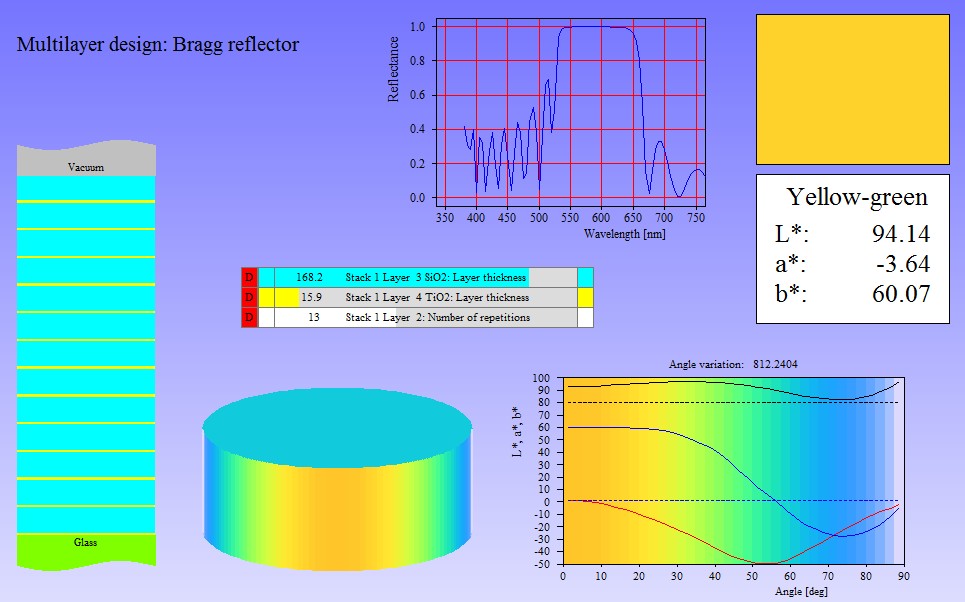
The angular dependence of the color of coatings can now be visualized in more ways. In addition to charts showing the variation of L*, a* and b* with angle you can now use a direct visualization of color in the main view.
You can introduce a colored background of the chart or show the appearance of a coated cylinder as shown in the example below. Like all view elements you have instant update if a parameter slider is moved.

If you would like to check what color difference a thickness change of a layer in a stack may cause you can do that quite easily with a new feature of ‘color fluctuation’ objects. These integral quantities compute, for thickness fluctuations defined in the layer stack, the size of the ‘color cloud’ that you can expect when producing the stack many times.
Selecting an object of this type in the list of integral quantities, you can now use the menu command ‘Export data’ to generate a *.csv file with a table of color values that you get when the layer thickness values are individually modified. The files can be immediately opened by Excel, for example. Here is an example:

Hardware and software for optical spectroscopy


