Tag Archives: CODE

New hardware controllers

We have added some new hardware controllers which operate components used in optical setups. Together with the built-in spectrometer controls you can now automate optical measurements. All hardware controllers are objects in the list of spectrometers.

These are the new controllers:

  • WOSP shutter: Controls the motion of a servo motor through a TinkerForge servo brick. Can be used to control a mechanical shutter to block a light source. Or move something else …
  • WOSP traverse: Controls a stepper motor through a TinkerForge stepper brick. Can be used to control the motion of a traverse system driven by a stepper motor. Or some other kind of motion …
  • WOSP color sensor: Operates a TinkerForge color sensor for rapid measurements of brightness and color. This device does not record color coordinates L*, a* and b* correctly, but does rather rough measurements of RGB values. Very useful in combination with triggers (see below) …
  • WOSP camera: Connects to any webcam of your Windows system and shows the image in real time
  • MINT traverse: Controls the motion of a traverse system addressing a MINT controller.

In addition, objects called ‘WOSP triggers’ can automatically start scripts if a pre-defined condition becomes true. Triggers are used together with the automation timer. You can, for example, record a reflectance spectrum at each timer event. The average reflectance will be almost zero when there is no sample and higher once a sample is present. A trigger can now use the average reflectance value to verify the presence of a sample and execute a sample measurement with automatic saving of the recorded spectrum.

Color fluctuation – bugfix and new feature

The integral quantity “Color fluctuation” computes the variation of color in the case of thickness fluctuations of a layer stack. Up to now the size of the “Color cloud” is computed using distances in L*, a*, b* space. You have now the additional option to compute the distance in the a*,b* plane only, neglecting fluctuations for L*.

In addition, we have removed a bug in the computation: Be aware that the values computed with the new version are different from the ones calculated with previous versions – sorry!

Angular color: New visualization

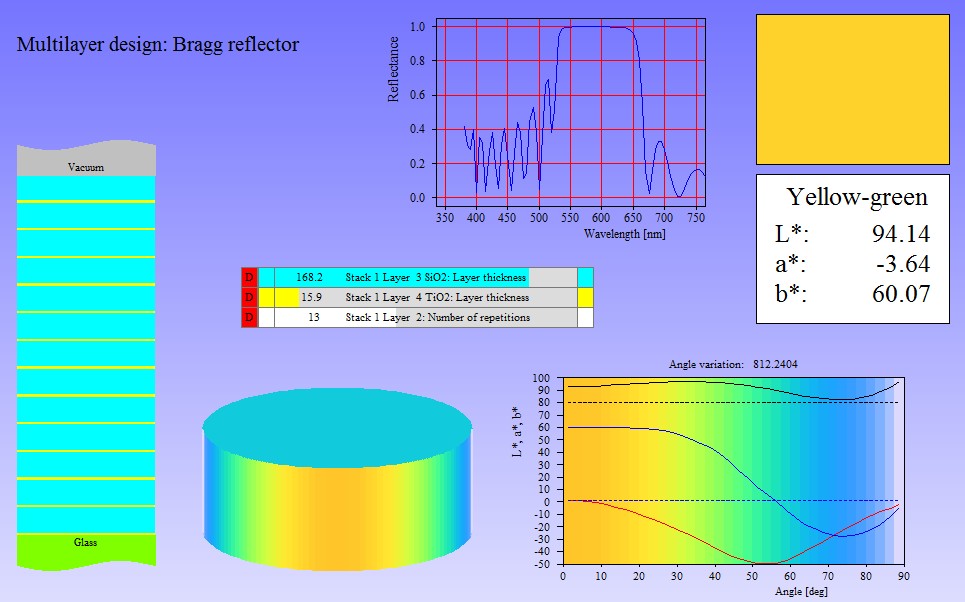
The angular dependence of the color of coatings can now be visualized in more ways. In addition to charts showing the variation of L*, a* and b* with angle you can now use a direct visualization of color in the main view.

You can introduce a colored background of the chart or show the appearance of a coated cylinder as shown in the example below. Like all view elements you have instant update if a parameter slider is moved.

bragg reflector

Analysis of color sensitivity

If you would like to check what color difference a thickness change of a layer in a stack may cause you can do that quite easily with a new feature of ‘color fluctuation’ objects. These integral quantities compute, for thickness fluctuations defined in the layer stack, the size of the ‘color cloud’ that you can expect when producing the stack many times.

Selecting an object of this type in the list of integral quantities, you can now use the menu command ‘Export data’ to generate a *.csv file with a table of color values that you get when the layer thickness values are individually modified. The files can be immediately opened by Excel, for example. Here is an example:

layer sensitivity

Presentations with CODE

Object generation 3.98

We have been using CODE for a long time already to show interactive presentations about thin film optics. The related program features are now official parts of the software.

A CODE presentation is basically a sequence of configurations that provide the individual pages  of the presentation. There are some mechanisms to navigate through the presentation. If you maximize CODE and put it into presentation mode (key ‘p’ on your keyboard) you can show full screen presentations that look like Powerpoint. Inside, however, you are using fully functional CODE configurations with all slider and animation features.

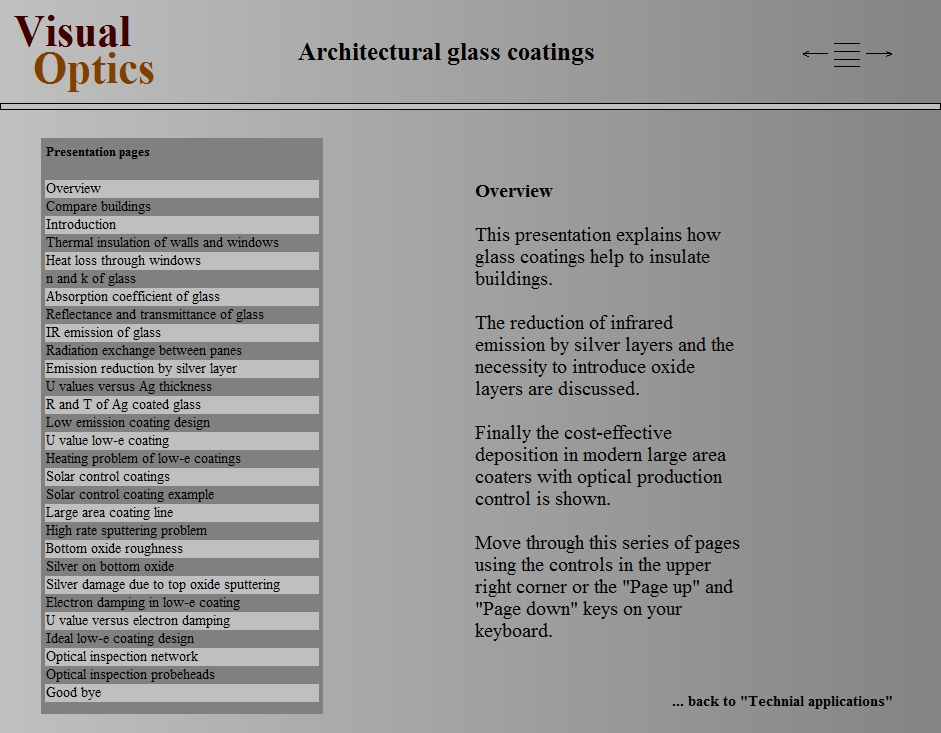
There are view elements for easy navigation. You can have a table of contents providing direct access of every page (on the left side in the image below) and a control to jump to the next, previous or first page (upper right corner):

presentation_start

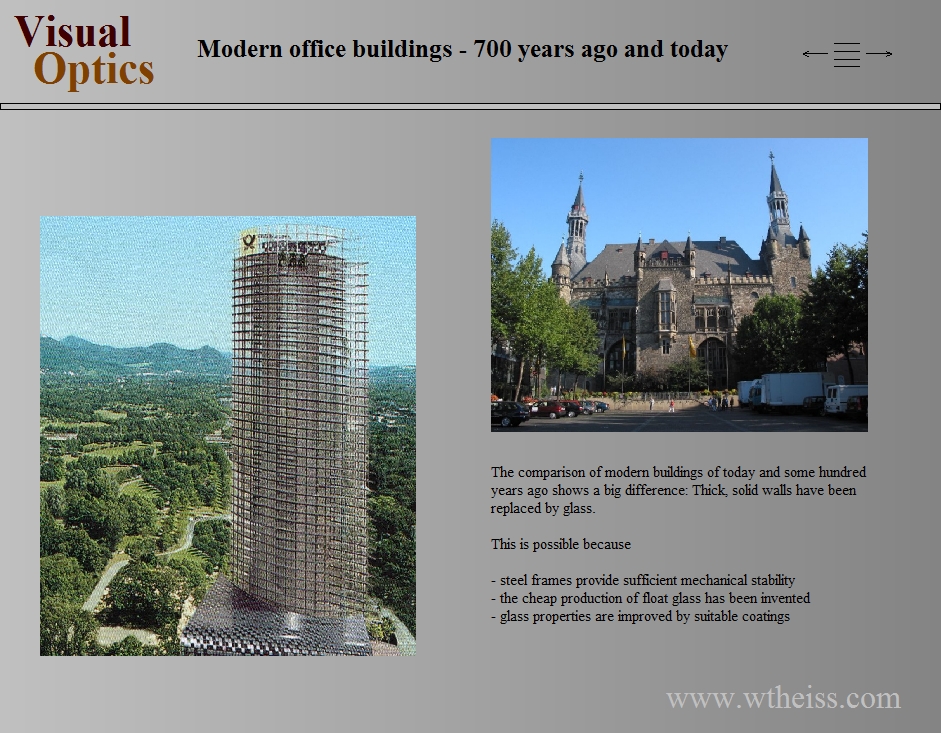
Your pages (=configurations files) can be either static

presentation_static_page

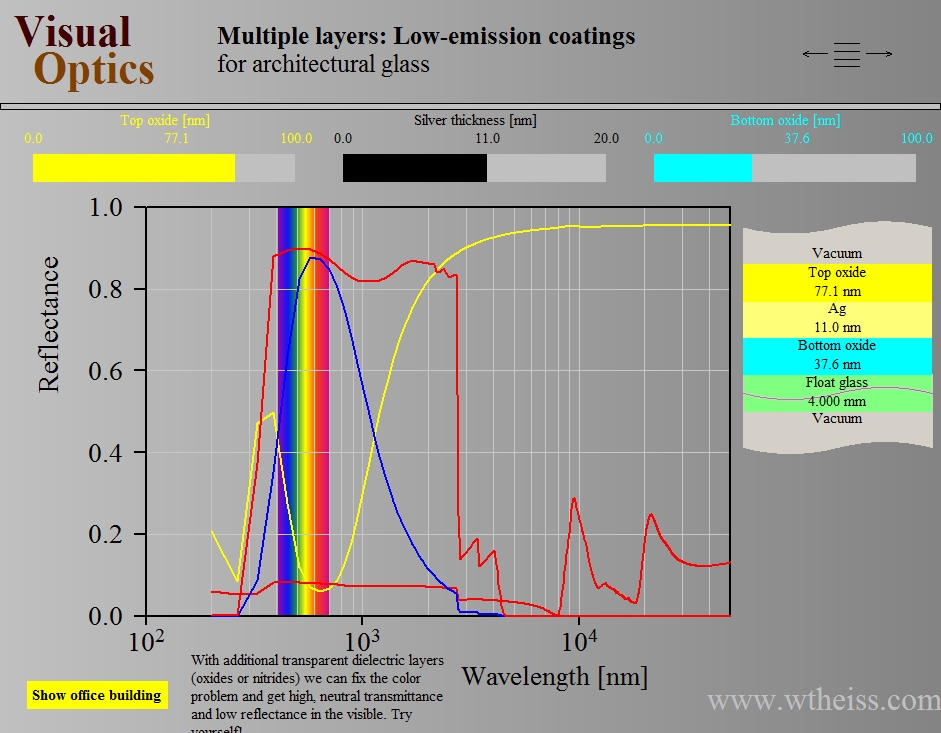
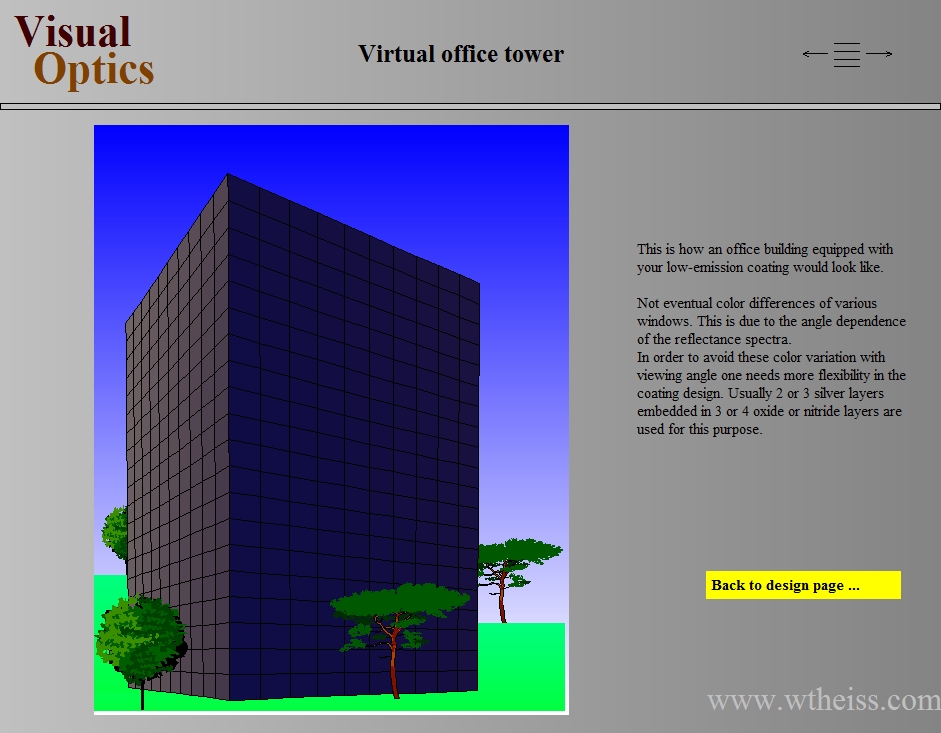
or dynamic, re-computing coating properties in real time while you move values by graphical sliders:

presentation_dynamic1

presentation_dynamic2

Here is the documentation of the new presentation feature. The online help system provides a link to a demo presentation that you can use to try it out yourself. You must have object generation 3.98 or higher.