Spectrometer triples …

In order to realize some hardware projects we have implemented spectrometer objects that can handle up to 3 Avantes or tec5 spectrometers. Spectra are recorded simultaneously.

We have used these objects for production control systems recording transmittance and reflectance from both sides of coated glass. In addition, we use 3 spectrometers in an integrating sphere system that records reflectance and transmittance of light scattering samples like textured solar glass.

Parameter variation improved

The global “parameter variation” mechanism (started by the menu command “Actions/parameter variation”) has been enhanced. From now on objects of type “Color angle variation” export their full angle dependence for every value of the parameter variation to the workbook. Tables for L*, a* and b* are written to individual worksheets.

Bug fix bright_eye_traverse.exe

A problem writing BREIN results files has been detected and solved: When the update of integral quanties has been switched off during parameter fits, the results files did not get the correct values. We have inserted an additional update command after the fit which ensures that the right values are written to the result file.

WOSP-MRC-DESKTOP

mrc_1

The WOSP MRC-DESKTOP system records reflectance spectra of glass panes or other flat and large samples for 30°, 45° and 60° angle of indicence.

Spectra are recorded in the wavelength range 380 … 1000 nm using halogen light sources and a Zeiss MMS 1 spectrometer. After calibration the time to acquire the required sample spectra is less than 10 seconds.

The image below shows the first demonstration prototype as presented at the ICCG 11 exhibition. The metal frame is based on ITEM parts which allow very flexible modifications of the setup, adapting the system to customer needs. All required optical parts are above the sample plane – in principle there is no size limit for samples.

mrc_2

Recording data requires 3 steps:

  1. Redording of the dark signal of the spectrometer. This takes about 3 seconds and does not require any action except a mouse click.
  2. Secondly, a reference mirror has to be placed at the sample position, and the signals for the 3 angles are recorded. Data acquisition takes less than 10 seconds.
  3. Finally, data are recorded for the sample which is placed on the table.

We recommend to take dark and reference spectra at least every 15 minutes.

mrc_3

The system is operated using our CODE-NF software which is a restricted version of our CODE thin film analysis and design software package. In CODE-NF you cannot perform automatic parameter fits – all other features of CODE are contained in CODE-NF.

CODE user interfaces are very flexible. We recommend to have a few buttons only, triggering dark, reference and sample measurements as well as the export of the obtained data.

mrc_4

WOSP-RT-DESKTOP

The WOSP RT-DESKTOP spectrometer system records absolute reflectance and transmittance spectra of glass panes or other flat and shiny samples. Measurements are done in a few seconds. A wide range of angles of incidence is possible: 8° to almost 80° (depends on sample thickness) for reflectance, and 0° to almost 80° (depends on sample thickness) for transmittance. No reference standard is needed for reflectance. You can record spectra with or without polarizer.

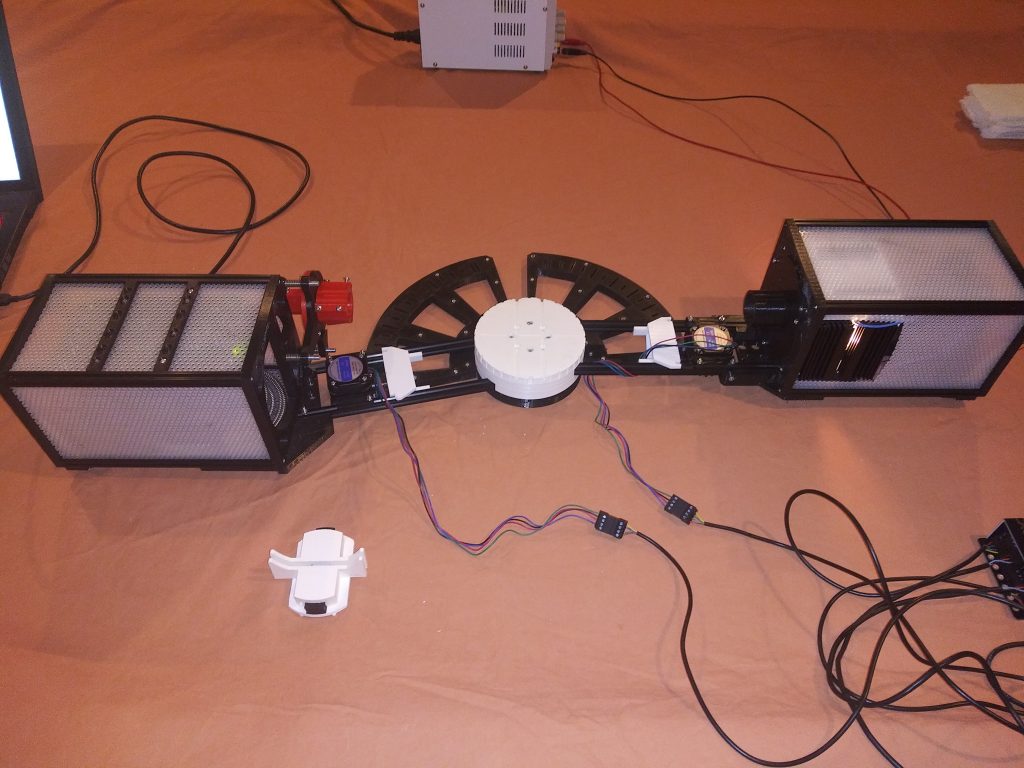
The system consists of

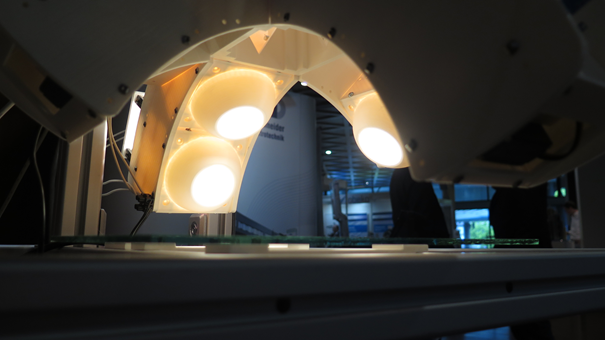
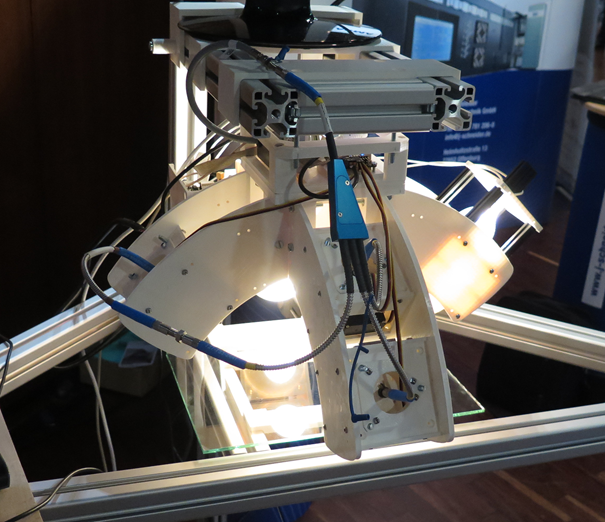
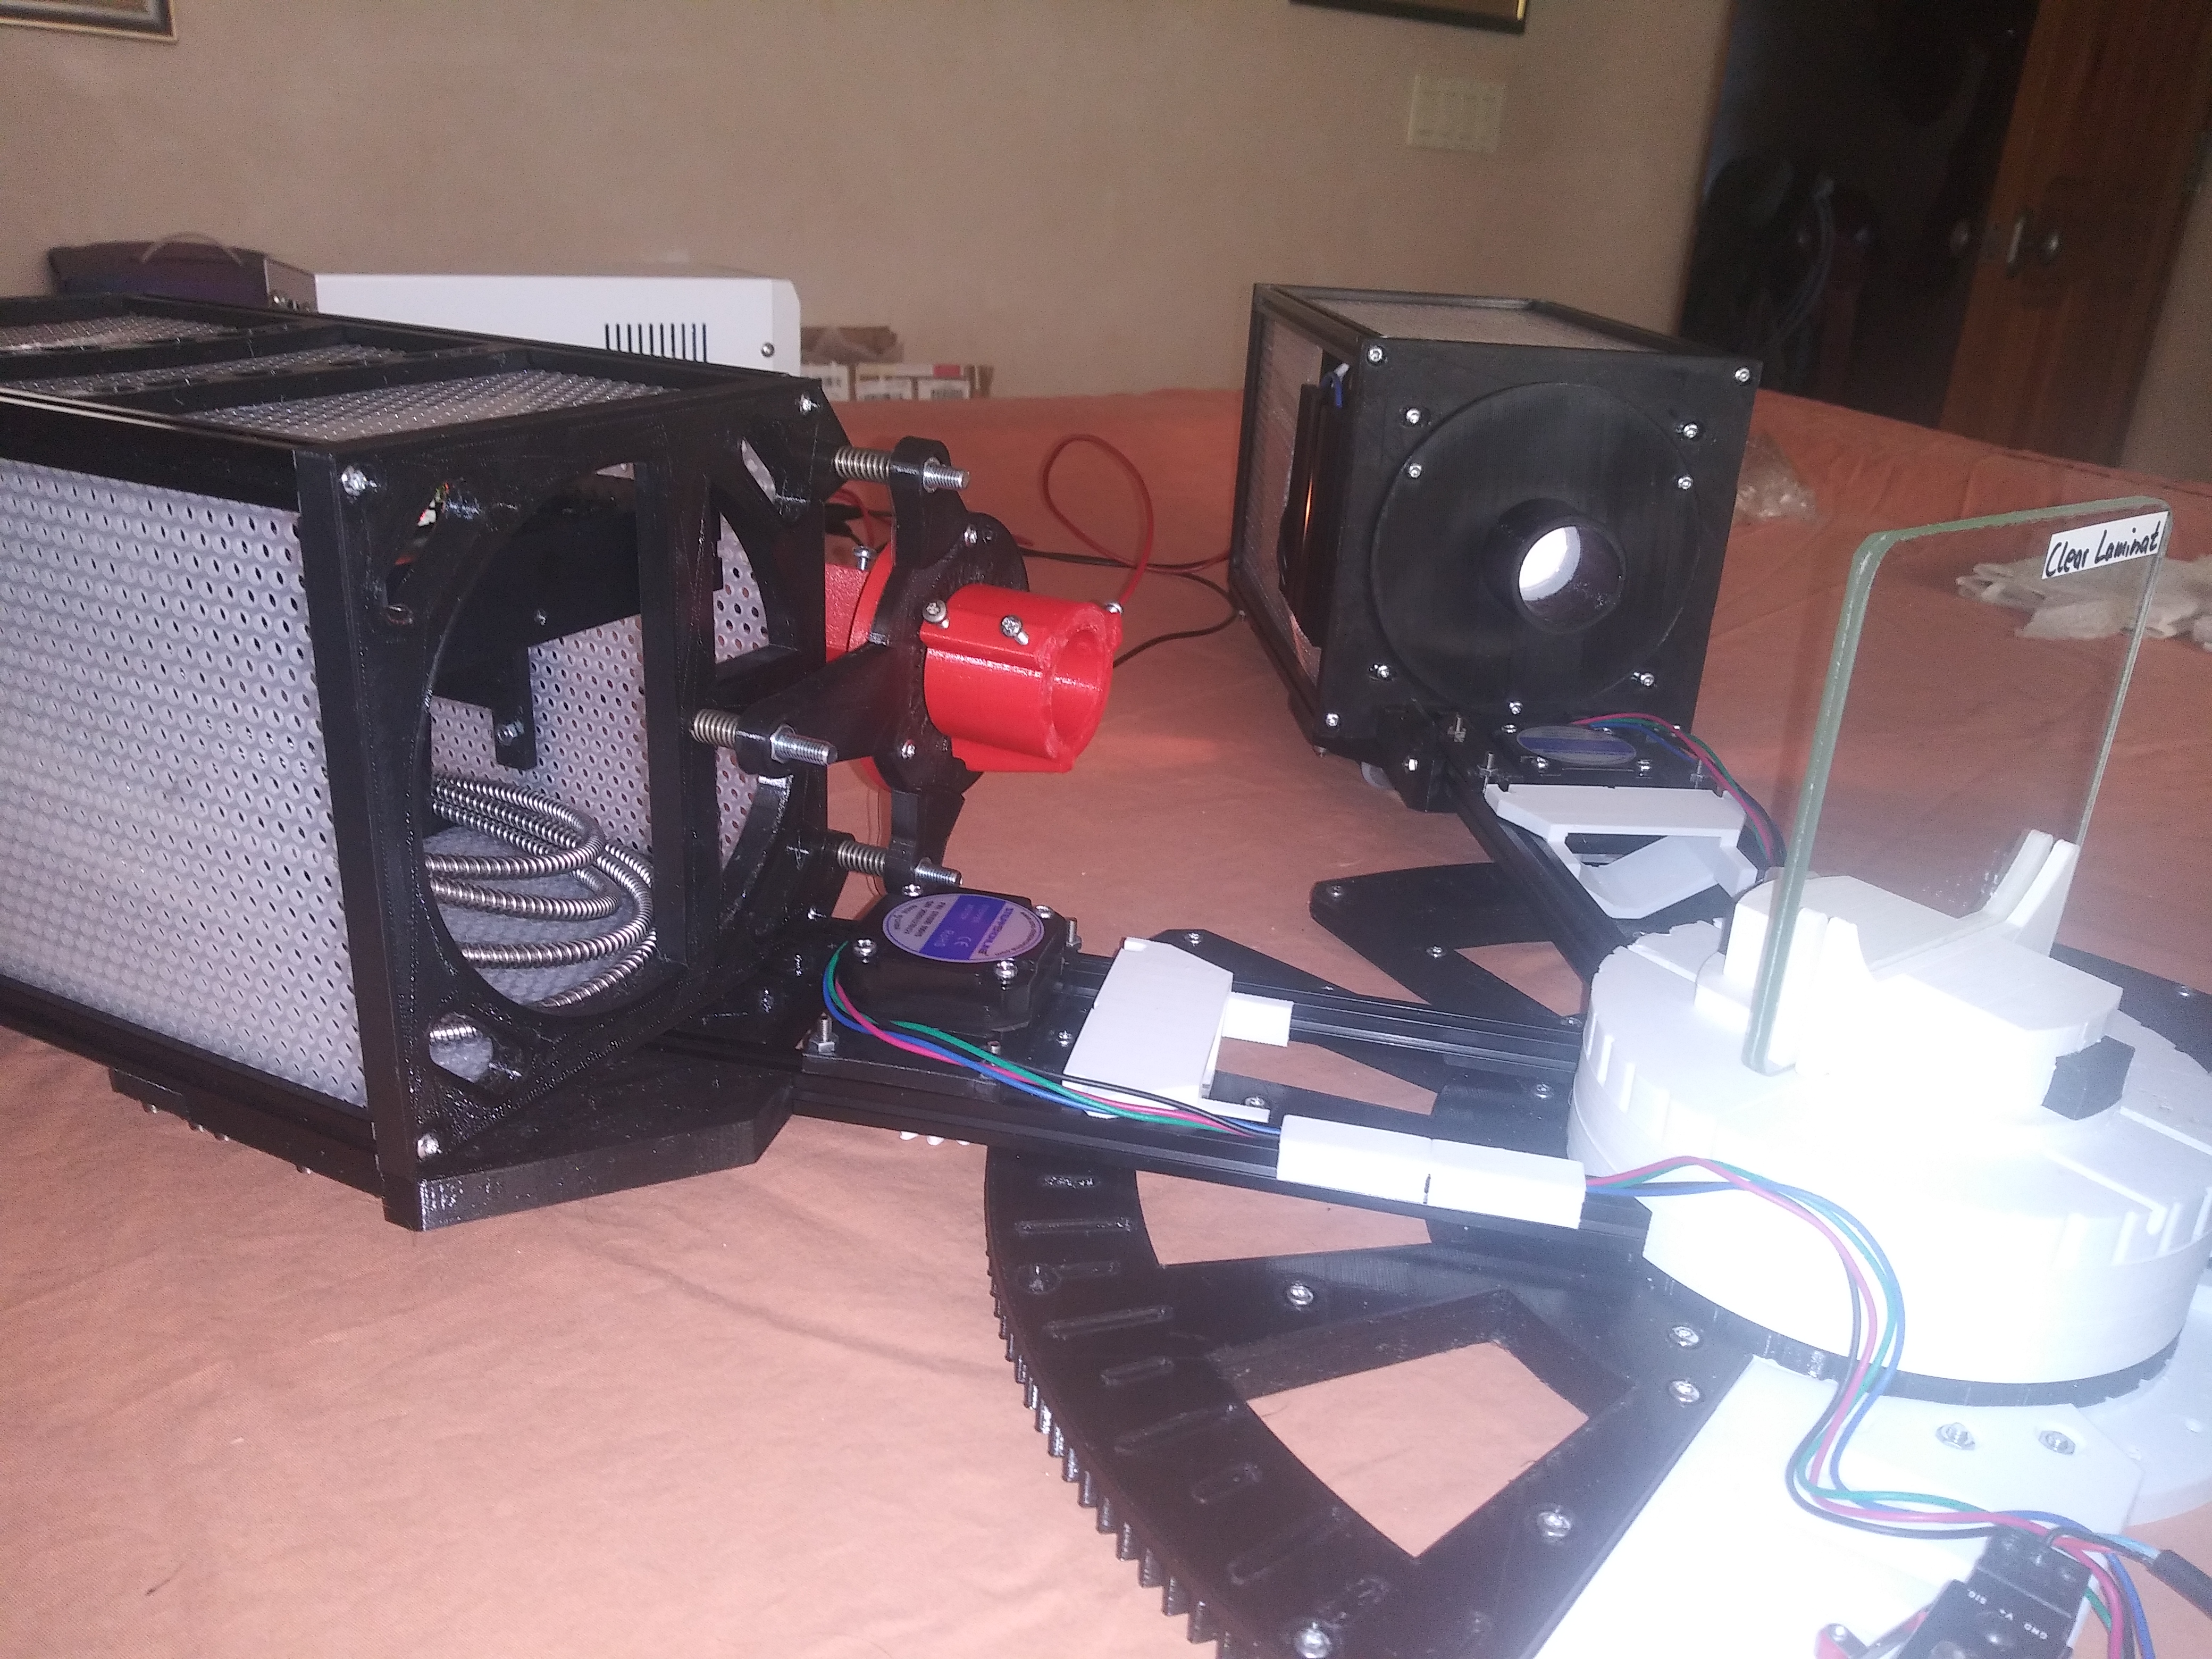
  • a WOSP-LEDO-P light source (combination of LEDs and halogen light source)
  • a mobile spectrometer unit (using an Avantes EVO spectrometer) with a field of view which is much smaller than the homogeneous area of the light source.
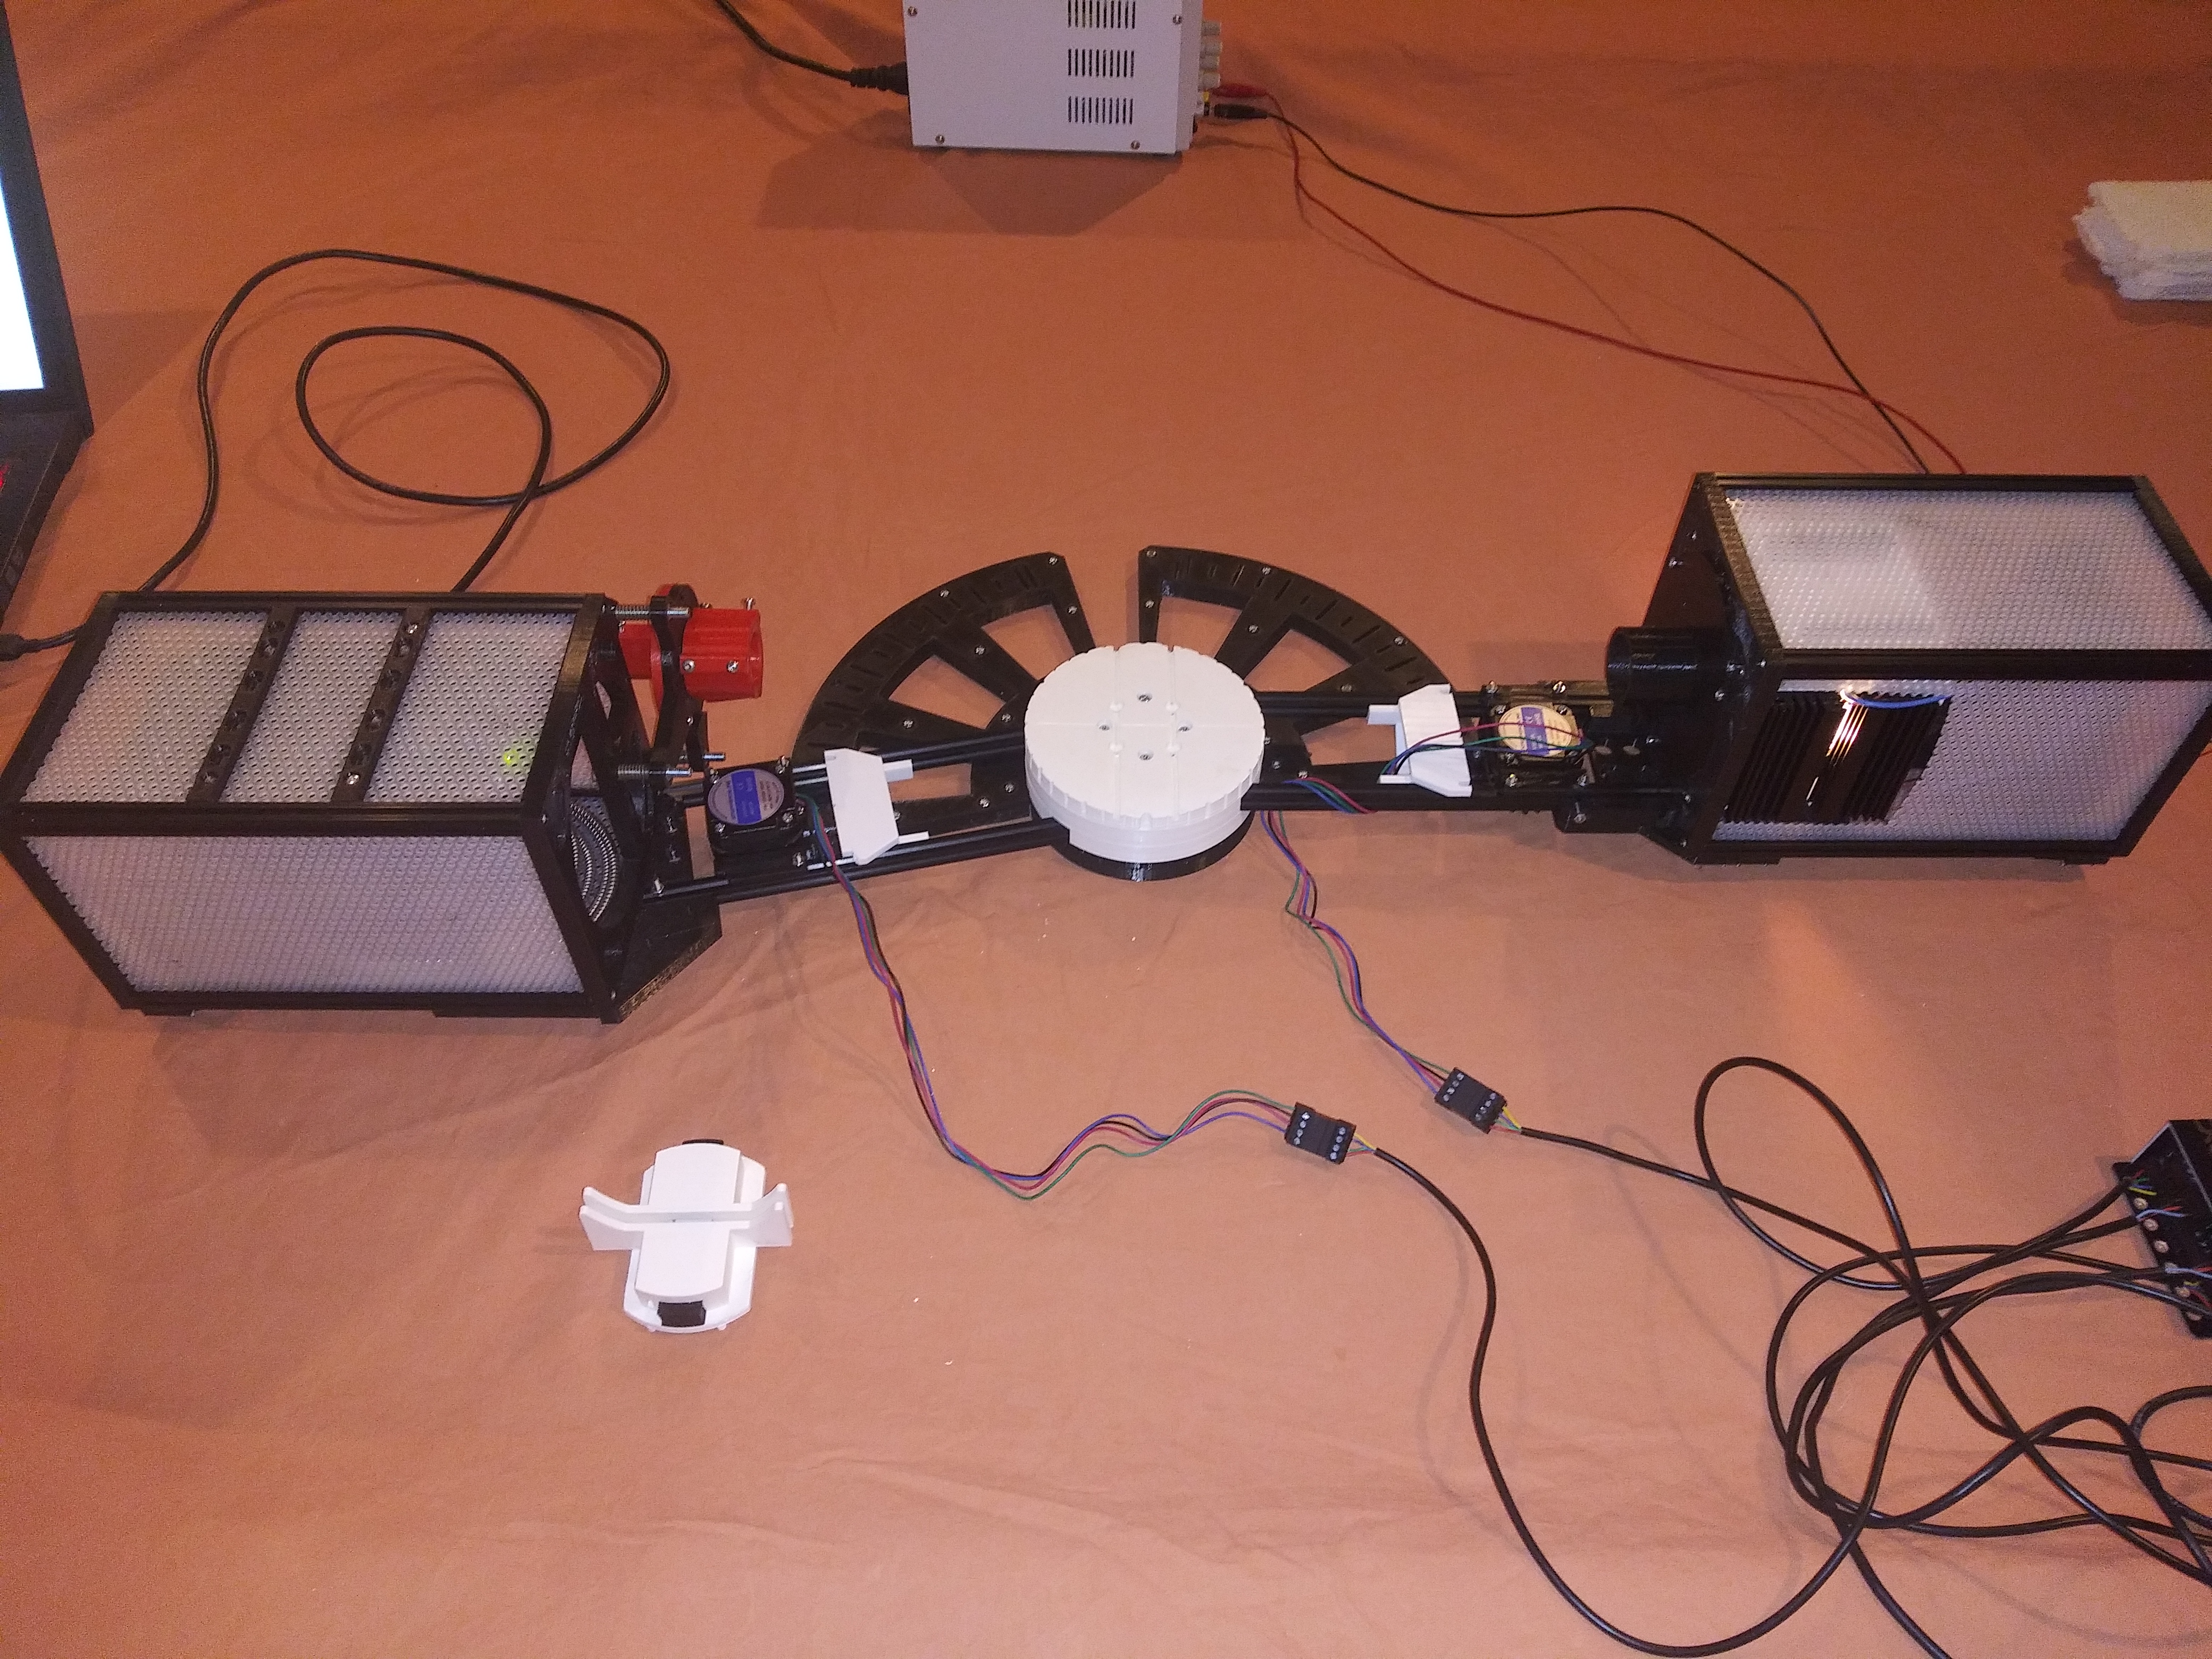
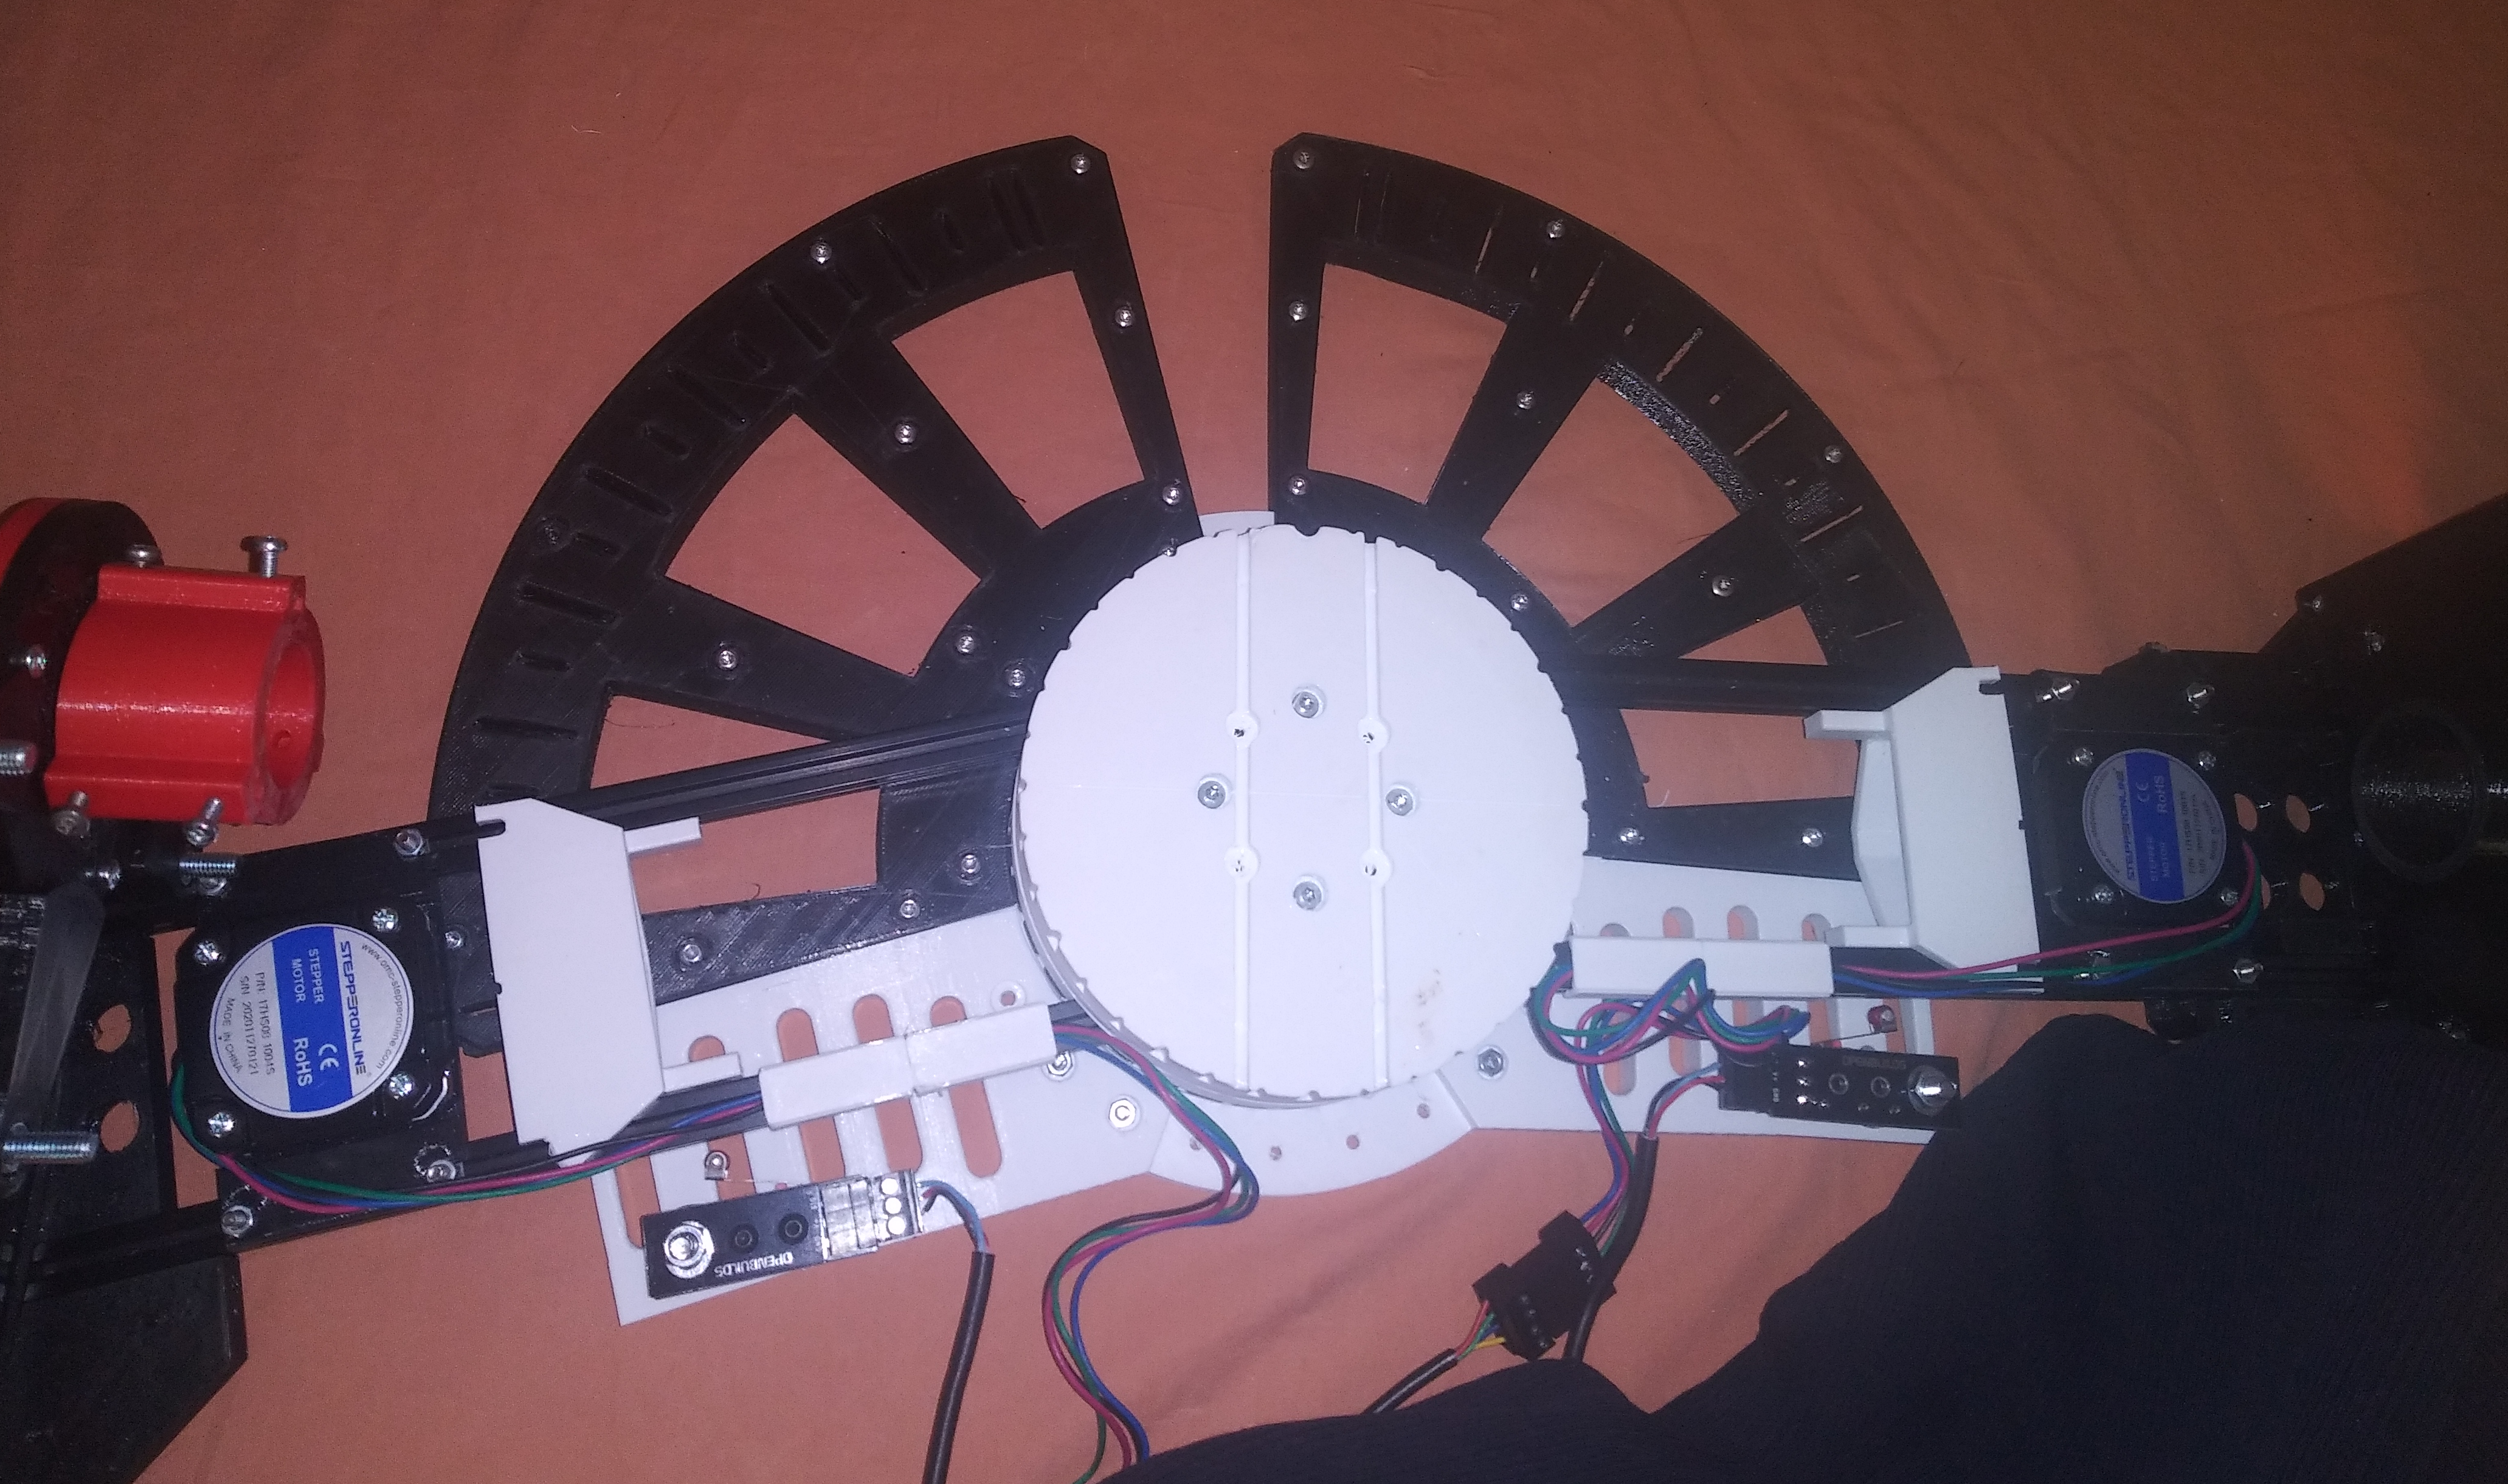
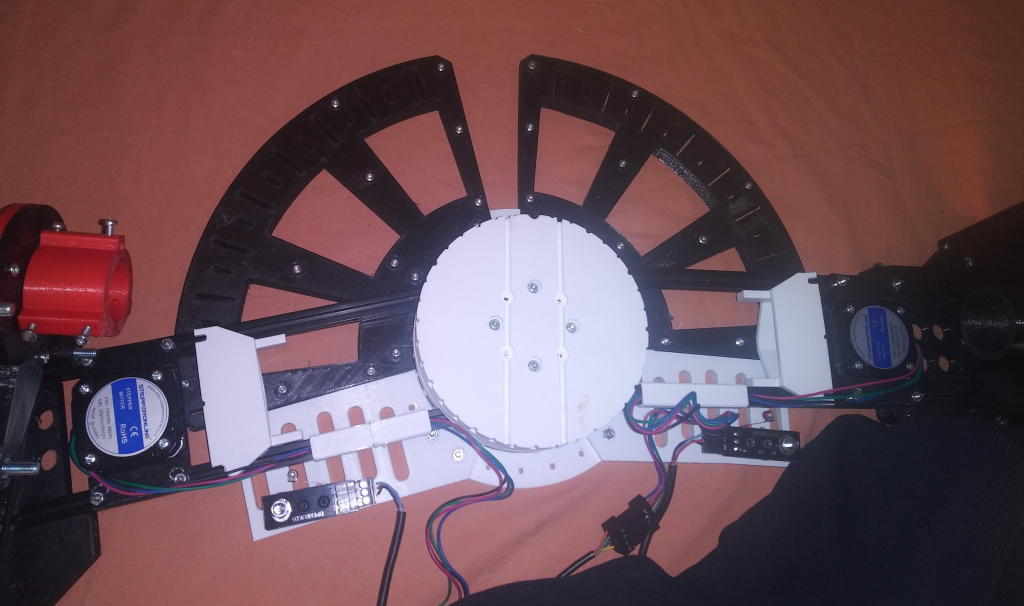
  • mechanical accessories that assist you in positioning all components (the prototype shown here has additional stepper motors which allow automatic angle scans – the motor drive is not yet part of the product).

Spectra are recorded in the range 270 … 1050 nm.

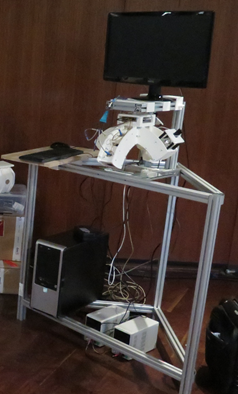
You need to provide a flat table (which is not part of the system) and electrical power. The spectrometer connects to a USB port of your computer.  Alternatively, you can use an ethernet connection.

How it works

You can move both the spectrometer unit and the light source on the table, performing the following sequence of actions:

  • Pointing the field of view of the spectrometer away from the light source (to a dark surface, ideally) you record the dark spectrum, i.e. the detector signals for vanishing light intensity. A suitable black background is provided with the product.
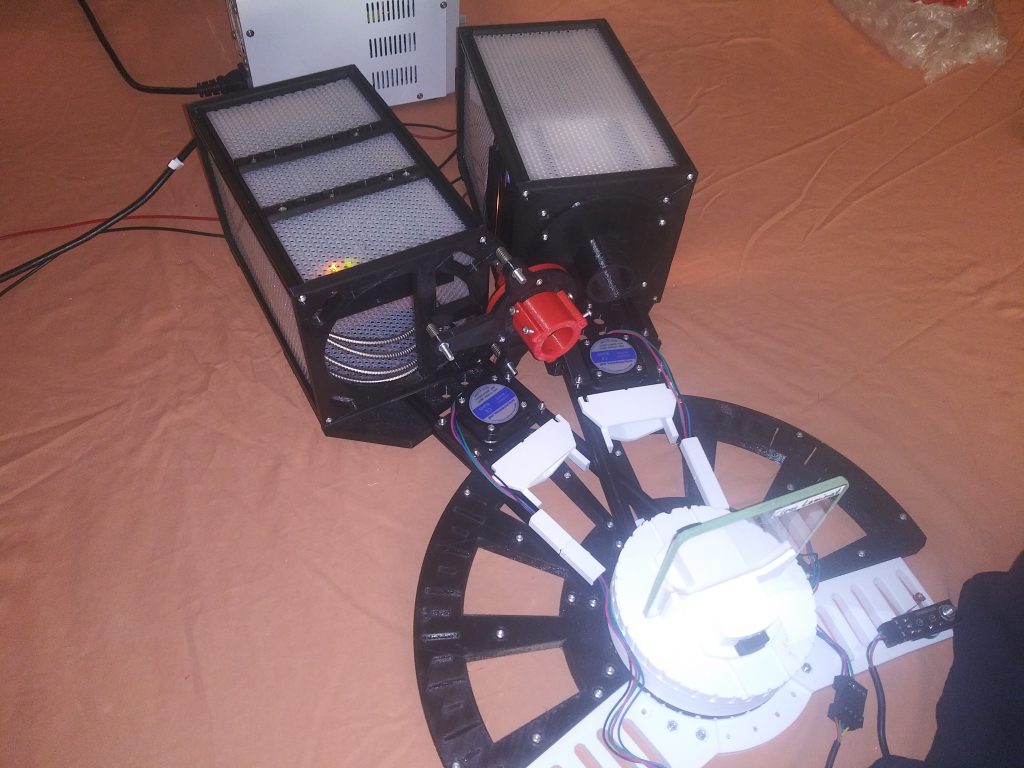
  • Then you arrange the components opposite to each other so that the full intensity (100%) is recorded:

  • From now on you can record absolute transmittance and reflectance spectra for various angles of incidence.

You are not limited to absolute measurements – if relative measurements are more appropriate for a given problem, you are free to go this way as well.

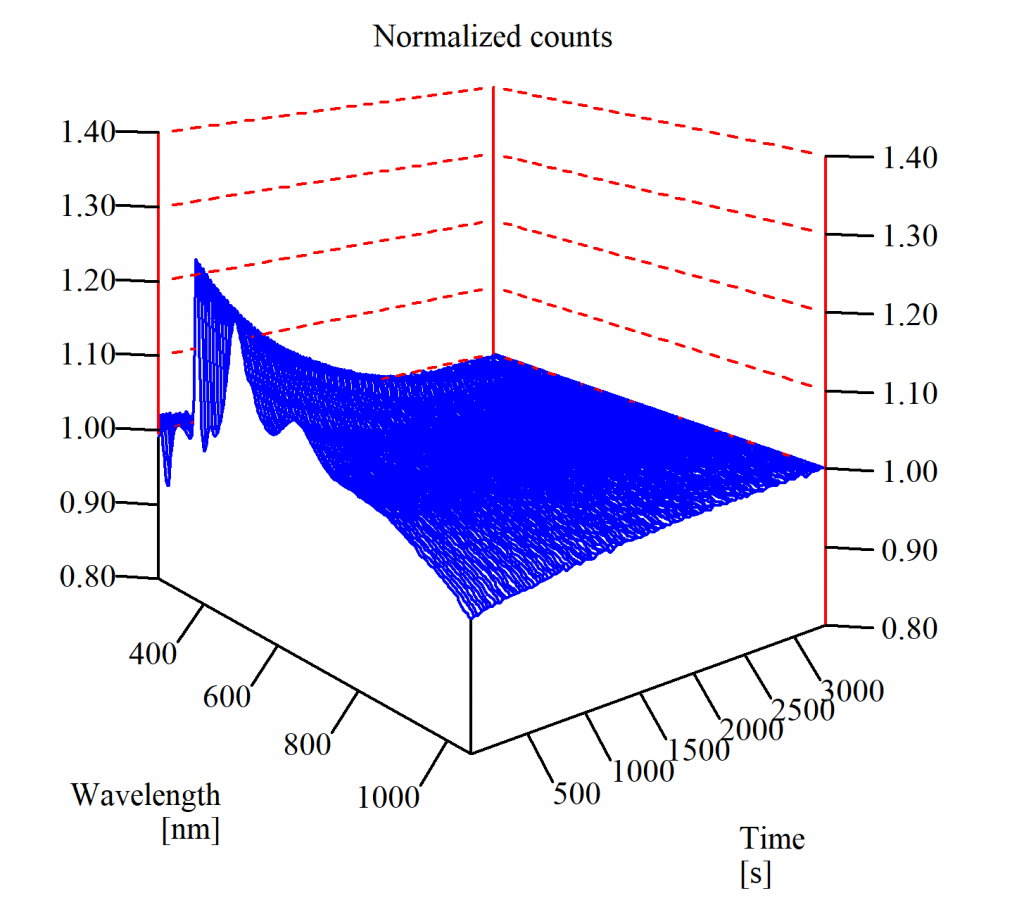
Once switched on, the system needs about 45 minutes to stabilize. Here is the development of normalized counts over time:

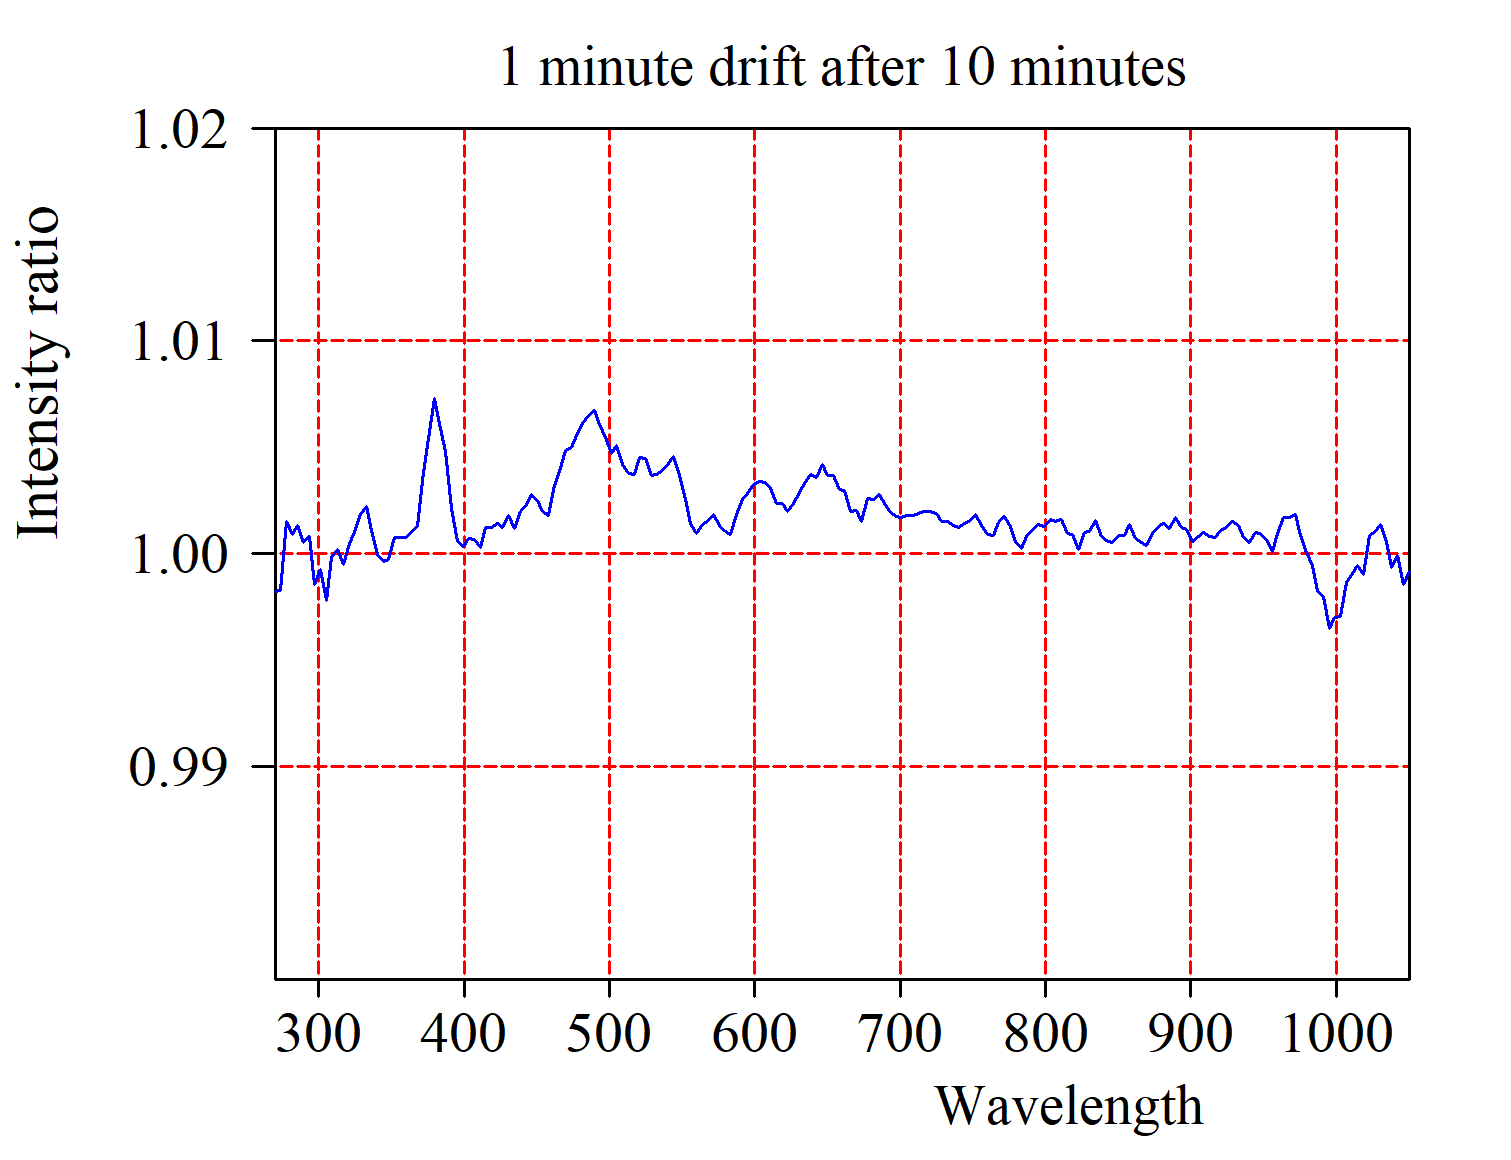
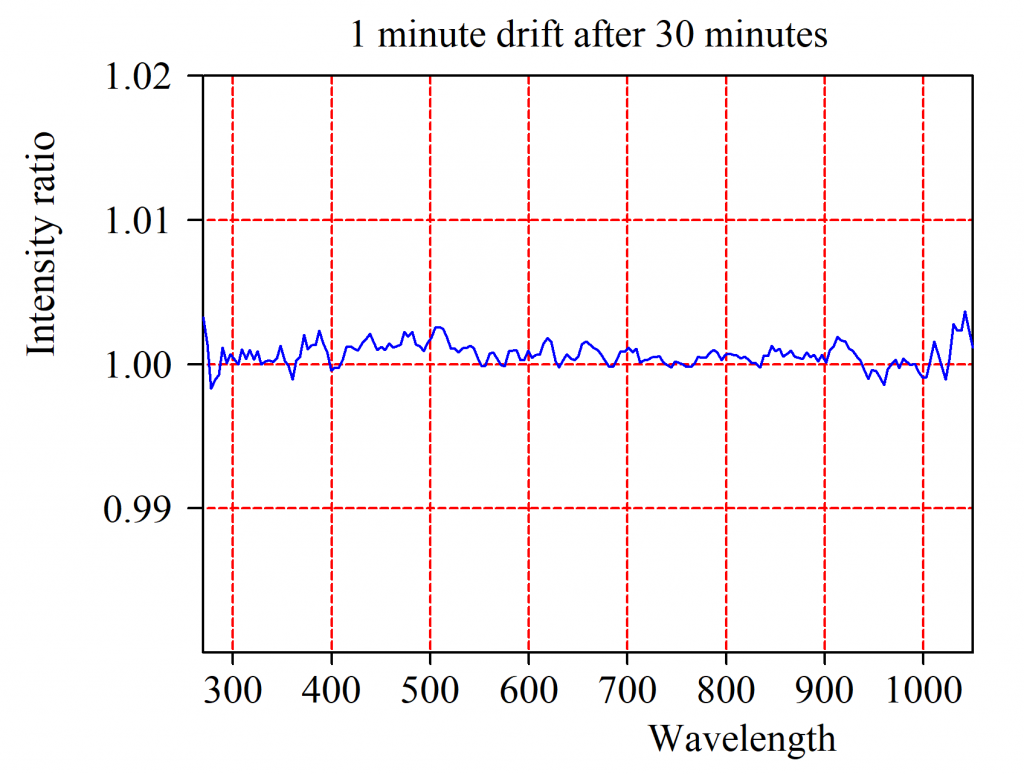
However, this does not mean that you cannot do useful measurements in between: A single measurement takes a few seconds only, and a full automatized angle scan (once the stepper drives are available) takes about 1 minute. The drift over 1 minute time is less than 1% after 10 minutes warming up, and less than 0.5% after a warm-up time of 30 minutes:

The system is controlled by our CODE-NF software which allows to compute various technical data from measured spectra like color coordinates or integral transmittance and reflectance values. As an option you can upgrade to the full CODE software package which allows to obtain film thickness and optical constant values based on physical modelling.

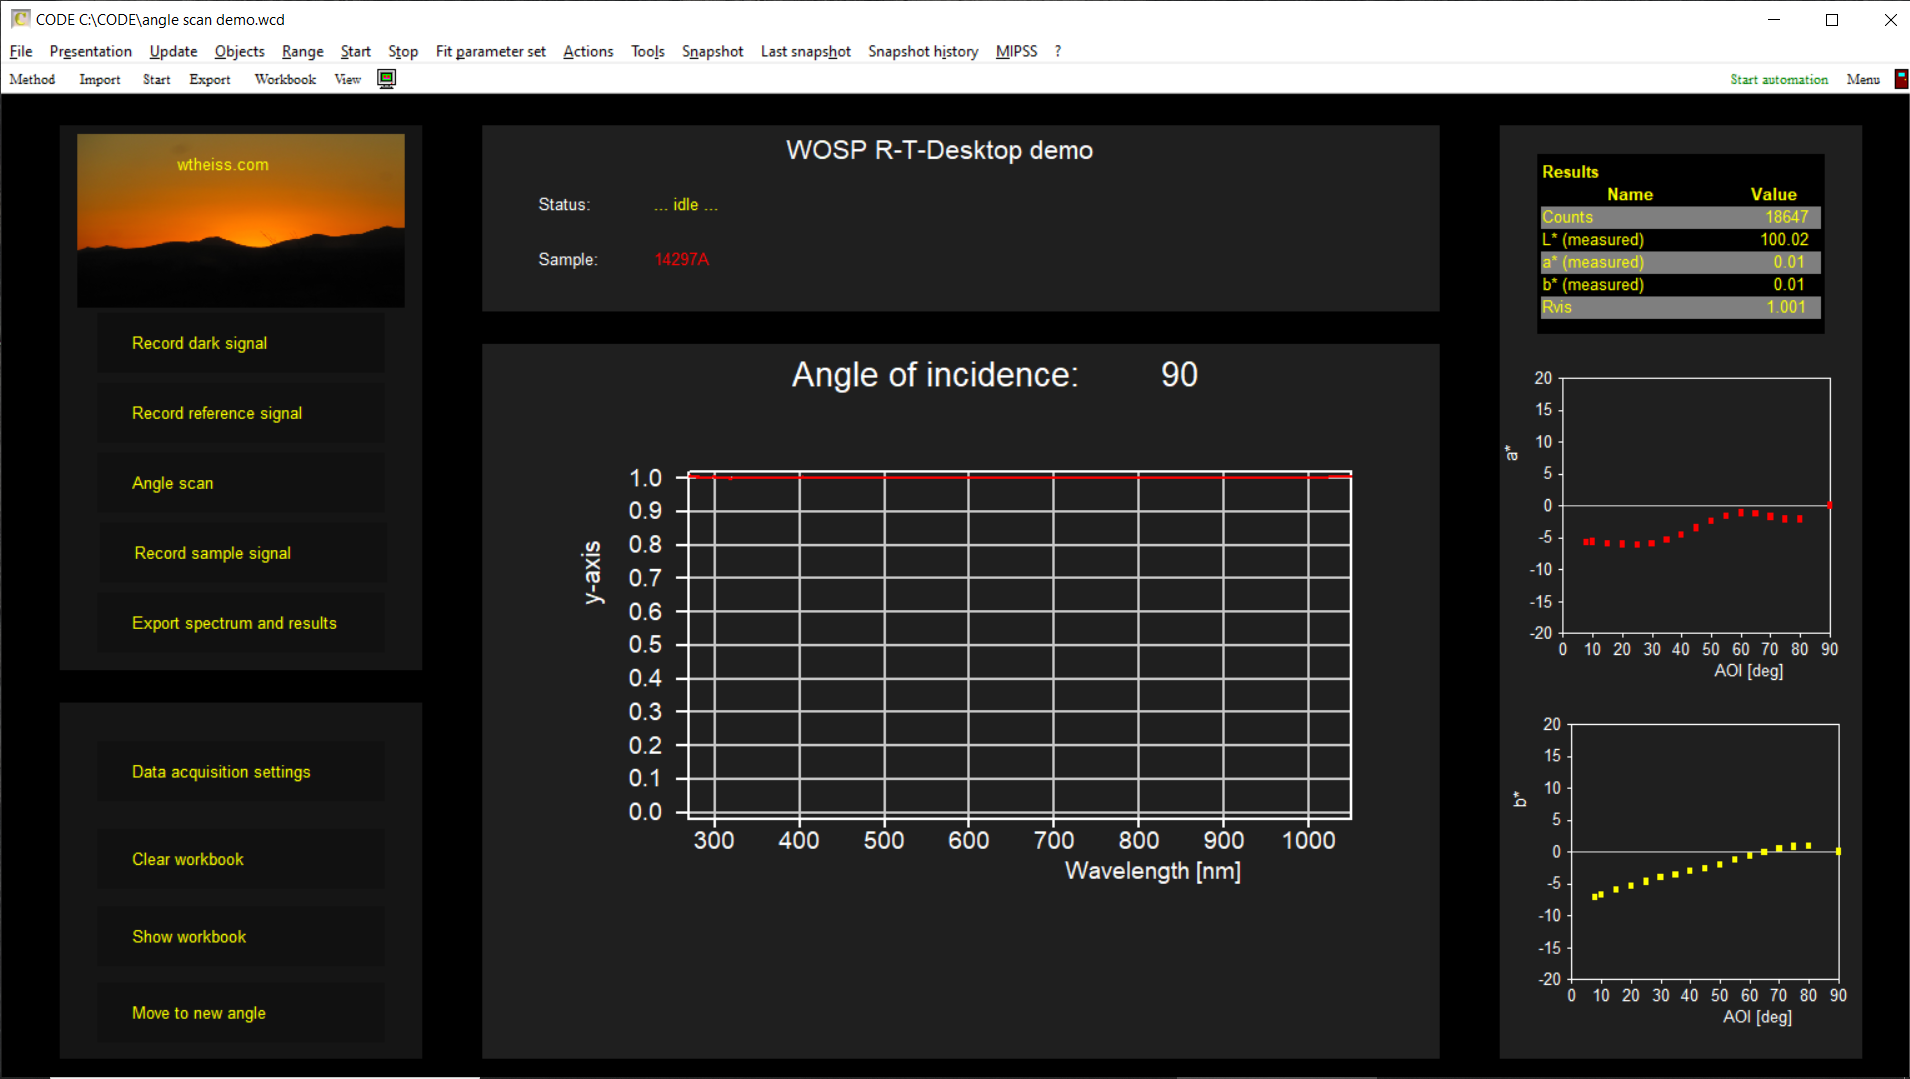
In order to record high quality spectra the operators need to execute a few commands only – the system provides a user interface which offers the necessary functions. Both CODE-NF and CODE are very flexible concerning user interfaces and script-driven automations. You can save measured spectra manually or automatically to files in folders or to a MySQL or Microsoft SQL server database.

Examples

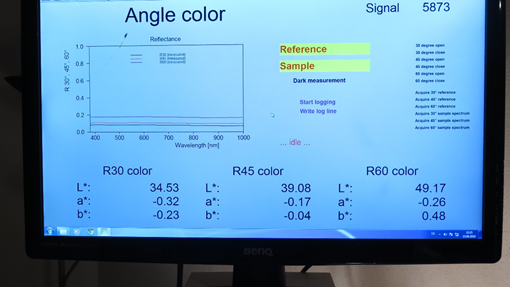
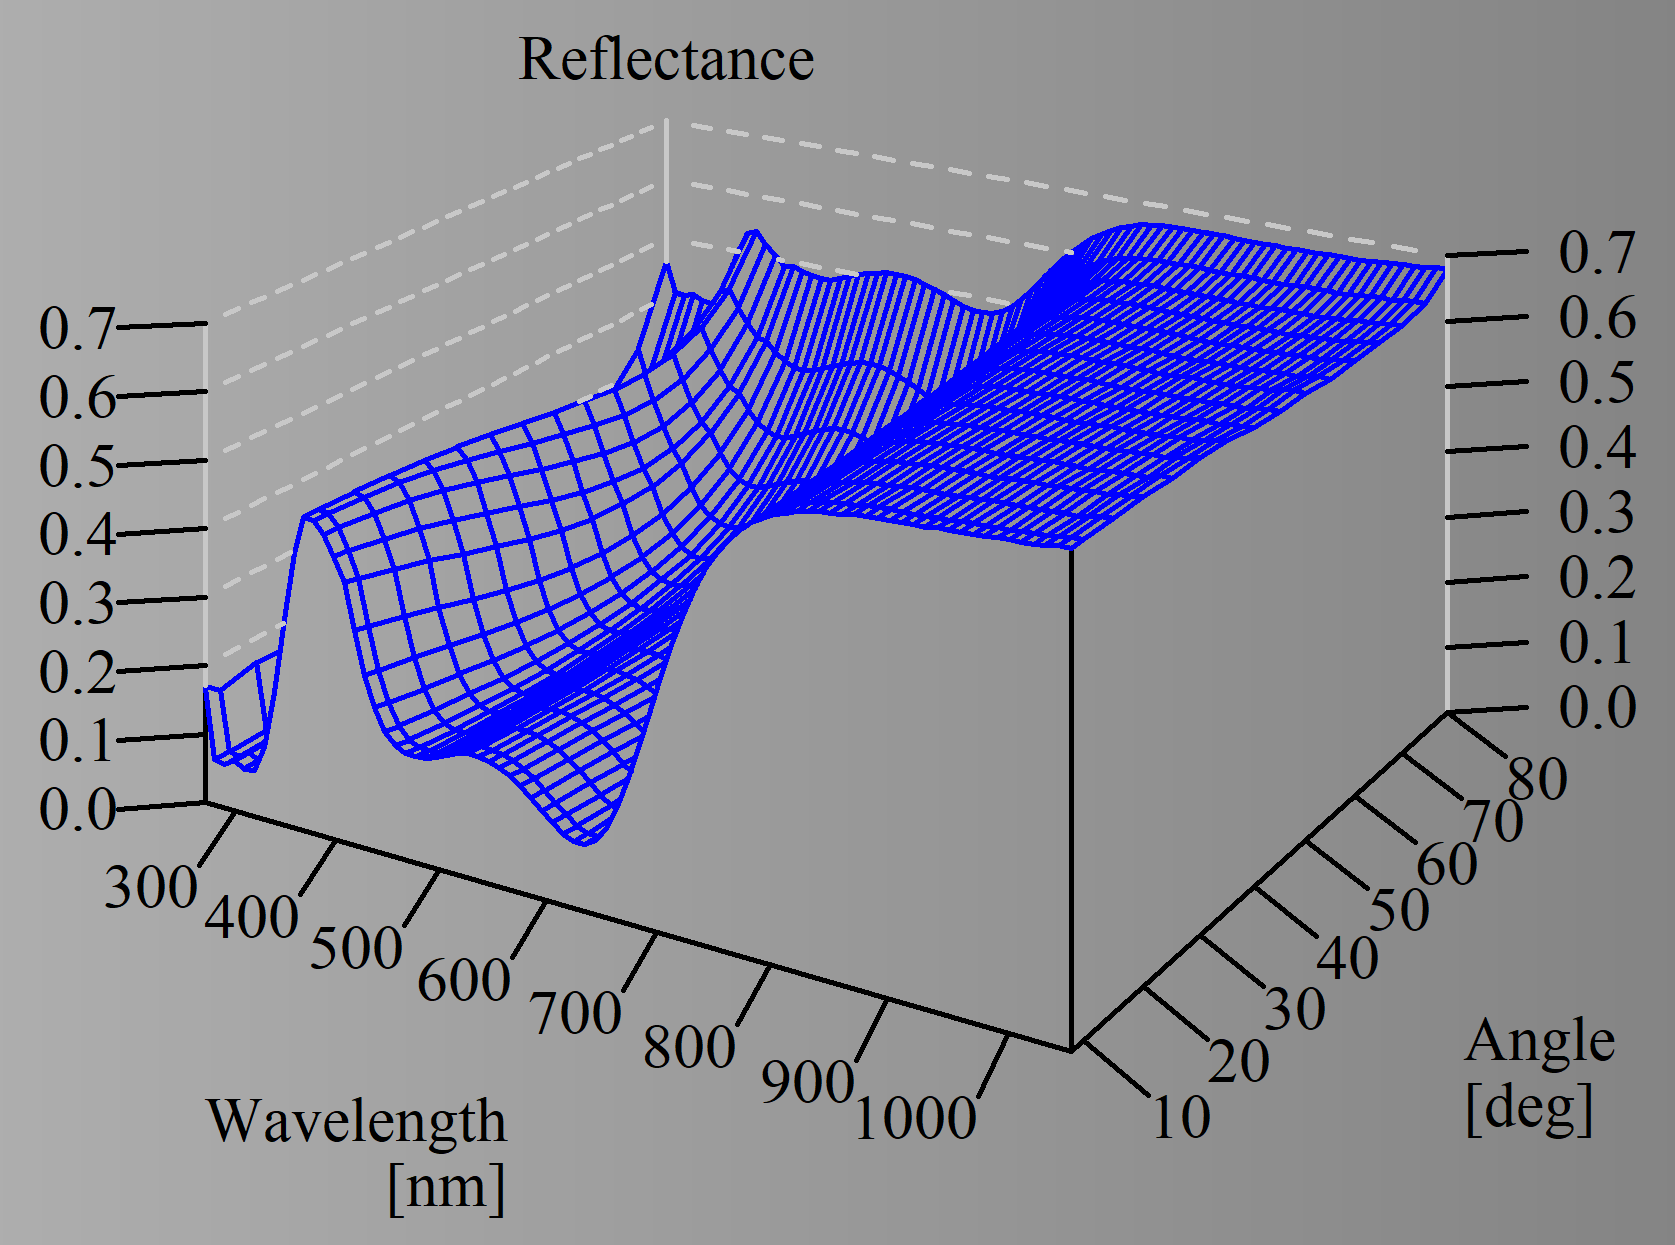
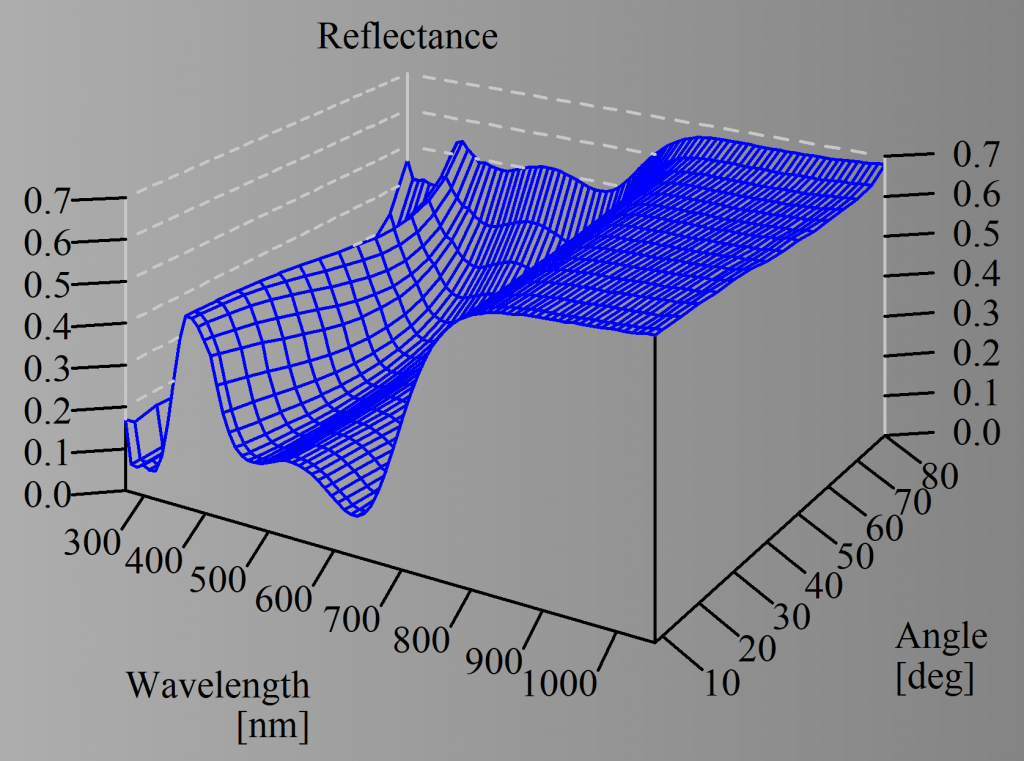
The measurements shown below have been taken during measurements done on automotive glass coatings (used in a laminate). Samples were provided by C. Köckert of VON ARDENNE GmbH (thanks a lot!) – they do not represent a regular coating product but have been generated for product development purposes. The measurement system records a sequence of reflectance spectra, recorded at 8°, 10°, 15°, …, 75°, 80°. Spectra and color values are displayed and stored.

Here is a typical sequence of spectra:

After the angle scan the system checks for a drift of the light source (100% line) and displays the angle variation of color (a* and b*, in this case):

The graph below shows some details of an angle scan, namely the first 2 spectra taken at 8° and 10° angle of incidence for another coating as well as the 100% and 0% spectra after the angle scan. Measurement time for a single spectrum was 1.5 seconds. Note the high quality of the data:

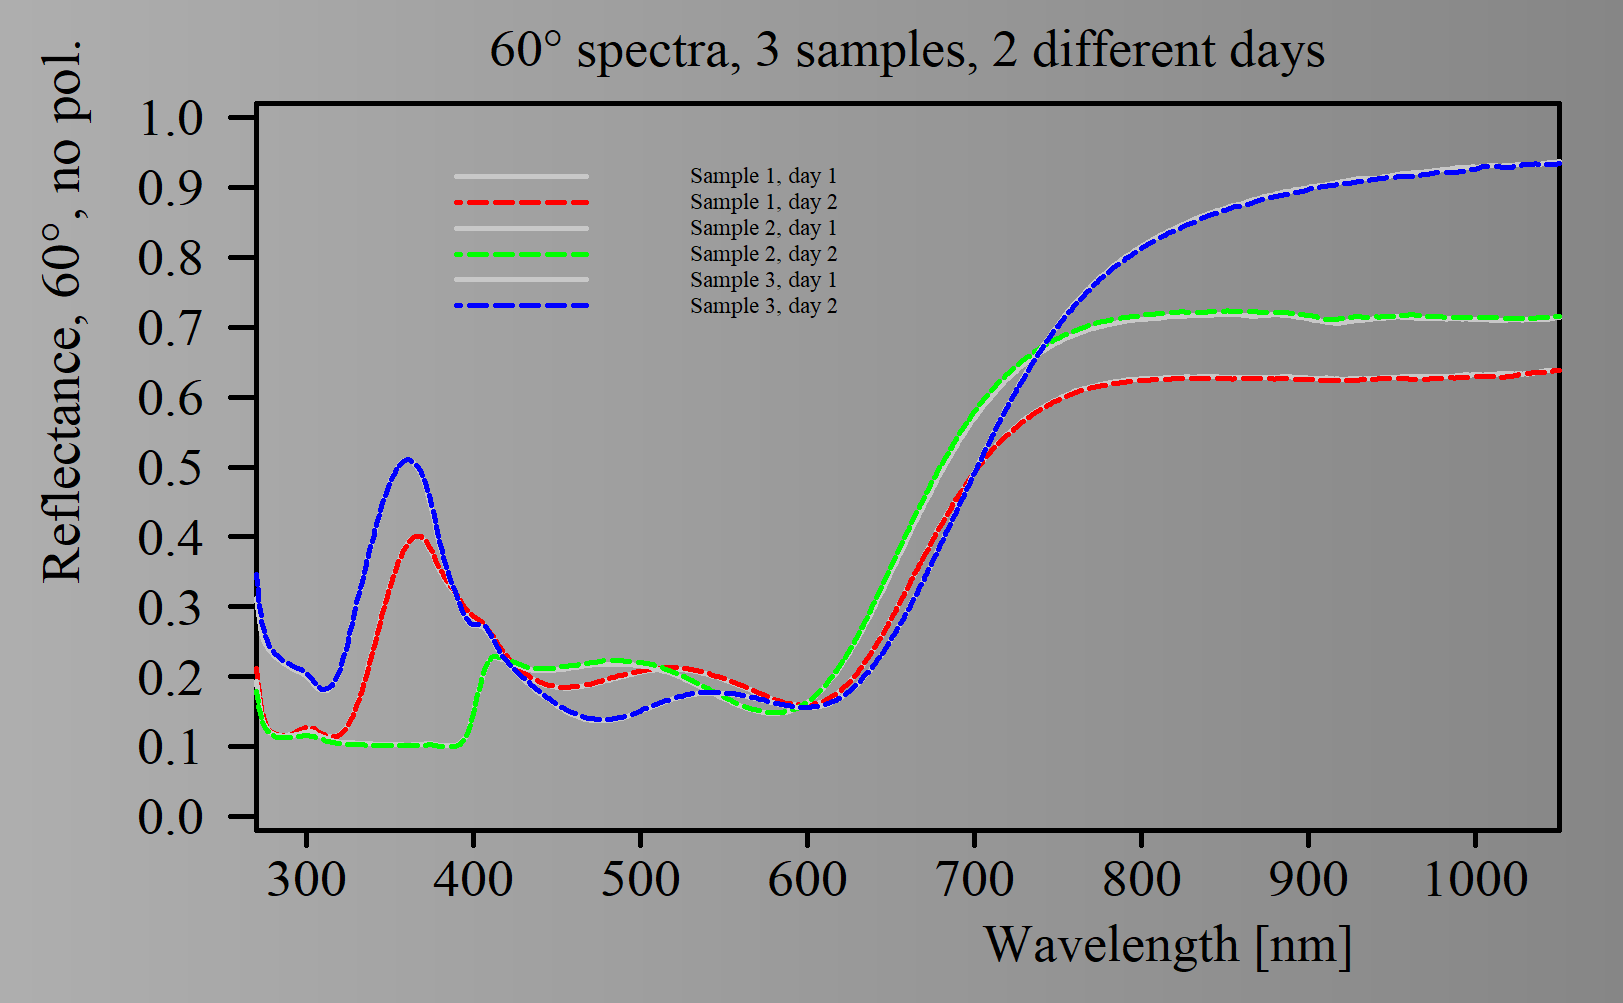
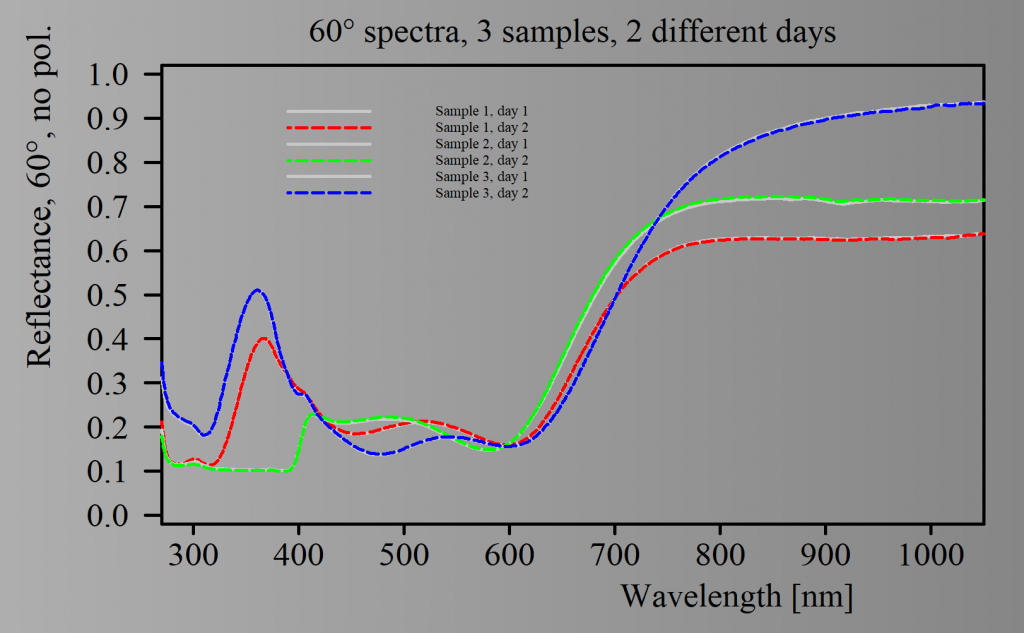
Repeatability is excellent – the graph below shows spectra (60°, unpolarized radiation) recorded for 3 samples at 2 different days:

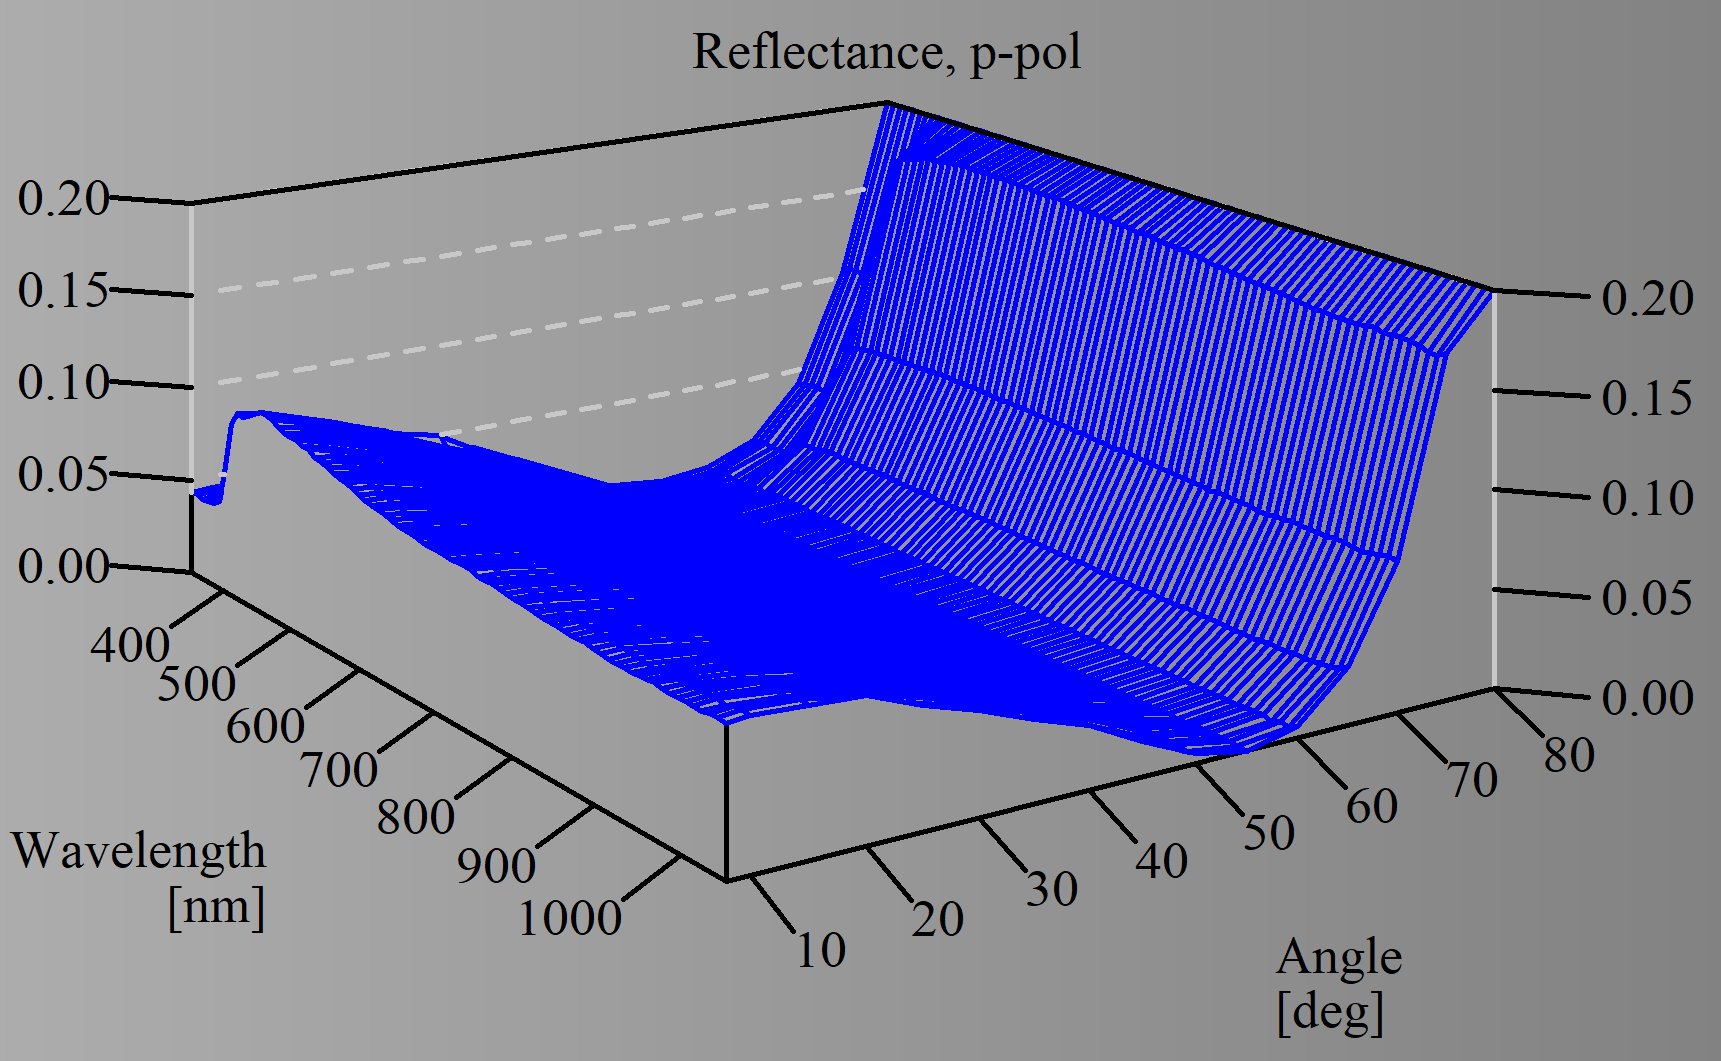
Using the polarizor restricts the usable spectral range to 350 … 1050 nm – below 350 nm the efficiency of the polarizor is poor. However, taking spectra in s- and p-polarization provides very valuable information for reliable thin film analysis.

Here is a scan of a plain glass laminate (i.e. without thin film coatings) in p-polarization, nicely showing the Brewster angle of glass around 55°:


Automated data acquisition enhanced

Starting with object generation 4.20 you can now select if a spectrometer object acquires new data at automation steps.

The default behaviour is to acquire new data at each automation step. Objects that do this are painted in red in the list of spectrometers. Objects which do not record data at automation events are drawn in gray.

In order to toggle data acquisition on and off press function key F4 (or F5).

NFRC U-factor computation

The computation of NFRC U-factors and SHGC values involves an iterative process to achieve a stable temperature profile within the glazing. The net energy flow is computed once temperature differences betweeen 2 iterations are below a threshold value. This value has been 0.0001 (K) up to now.

Starting in CODE version 4.20 you can individually set the threshold for each integral quantity. In particular, you can set smaller values to avoid (very small) differences between CODE and WINDOW results for U-factors.

New fit option: Maximum number of iterations

There is a new option to stop a parameter fit: You can set a maximum number of iterations (i.e. re-computations of the optical model).

This option allows to define a reproducable fit quality, independent of the computer speed and workload given by other processes.

Before you set the maximum you must figure out how many iterations are sufficient to reach your goals, probably adding some extra iterations for tough fit situations.

New optical function: refractive index from fringes

Narrow interference fringes of thick layers can be used to determine the refractive index of the sample if the mechanical thickness of the layer is known. The new optical function ‘refractive index from fringes’ provides this functionality, analyzing interference maxima.

Spectra must be provided in wavenumbers. The function requires 5 parameters:

  1. wavenumber minimum of the relevant spectral range
  2. wavenumber maximum of the relevant spectral range
  3. Minimum height of an interference maximum
  4. Minimum separation of 2 neighbored maxima
  5. Mechanical thickness in microns

The following example shows how to write a function call:

R (refractive index from fringes 2800 2900 0.2 2.5 754)