After some problems with corrupted configuration files we have decided to update the workbook component, starting with object generation 5.28. We hope that all workbook function work as before. If you find issues please be patient and report to us what you found. We will then try to help you as quick as we can.
Daily Archives: May 25, 2021
Variation of 2 model parameters
We have updated the list of special computations. You can now do variations of 2 parameters rather easily, using objects of type ‘2 parameter variation’.
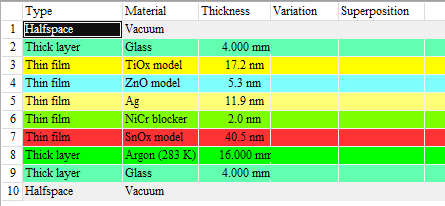
As an example we use a low-emission glass coating with several layers:
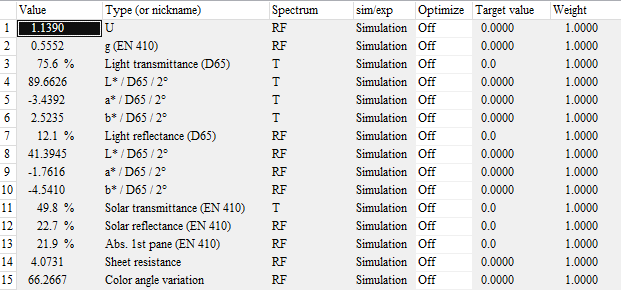
The goal of this exercise is to learn how the average transmittance in the visible (light transmittance) depends on the thickness values of the TiOx and SnOx layers. In our example configuration, the light transmittance is computed as third integral quantity:
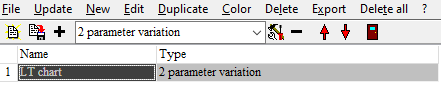
To do the required computations we generate an object of type ‘2 parameter variation’ in the list of special computations:
Editing the new object brings up this dialog:
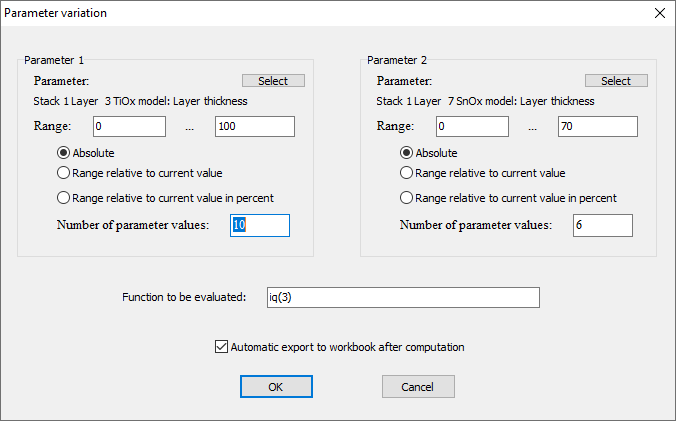
For each parameter you can select which one it is and how the range of values is chosen. The editor ‘Function to be evaluated’ allows to enter the quantity you want to compute for each pair of parameter values – in our case this is iq(3) (the light transmittance). If you check the option ‘Automatic export to workbook after computation’ the obtained data are written to the workbook.
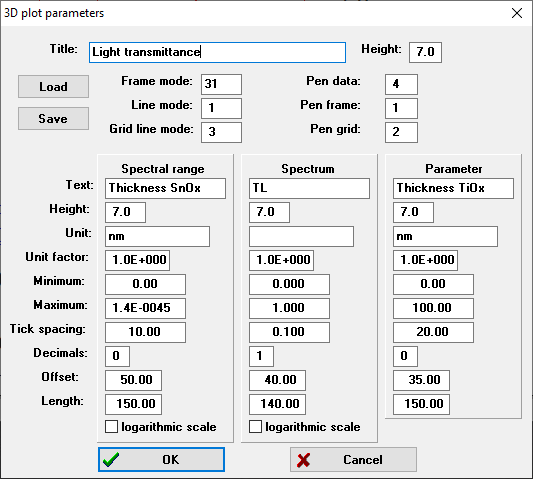
Once this dialog is closed another one opens which is used to set graphics parameters for the graph of the data. This graph can be shown in a view if you drag the special computation object to a list of view items. The first parameter (TiOx in our case) will be displayed on the parameter axis, the second parameter values (SnOx thickness) will be displayed along the x-axis:
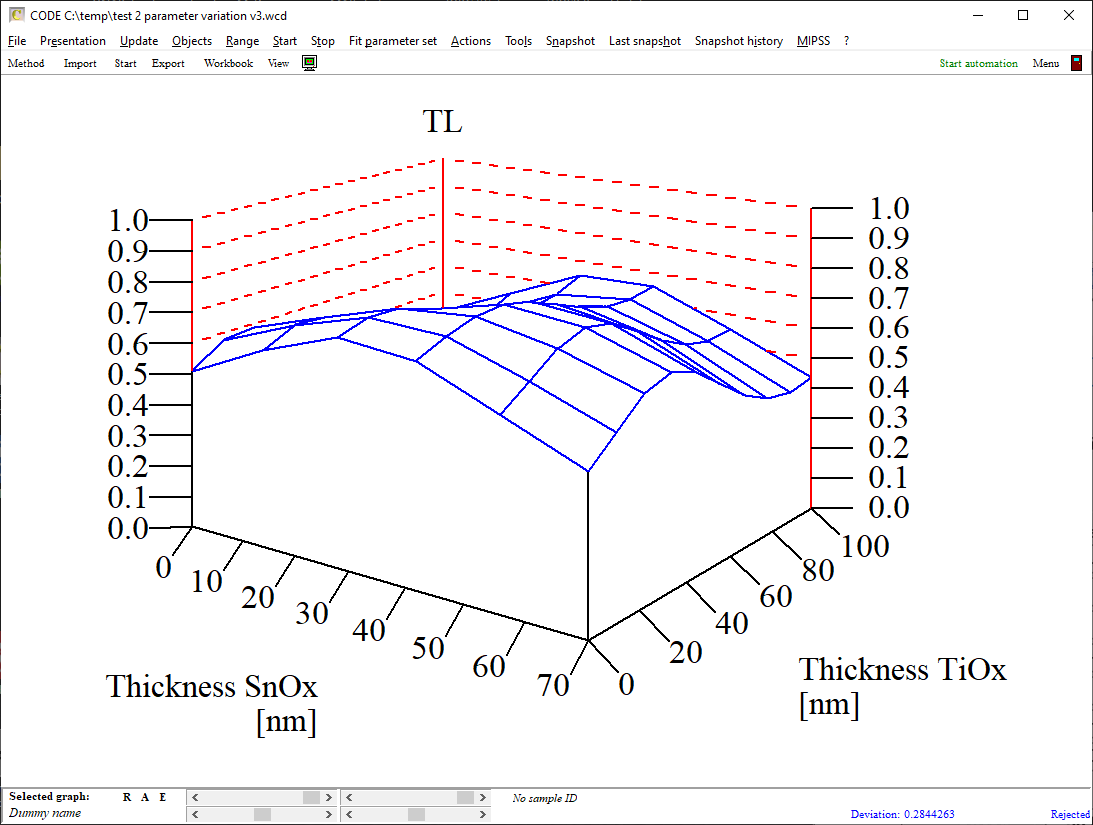
Please note: Computations may require some time for this type of object. Automatic updates are switched off which means you have to actively trigger the computation. You can do that in the list of special computations by selecting the object and then click the ‘Update’ menu item. If you display the object in a view re-computation is triggered by a click on the view object. Be careful to click only when you really want to start a new computation!
The graph looks like this:
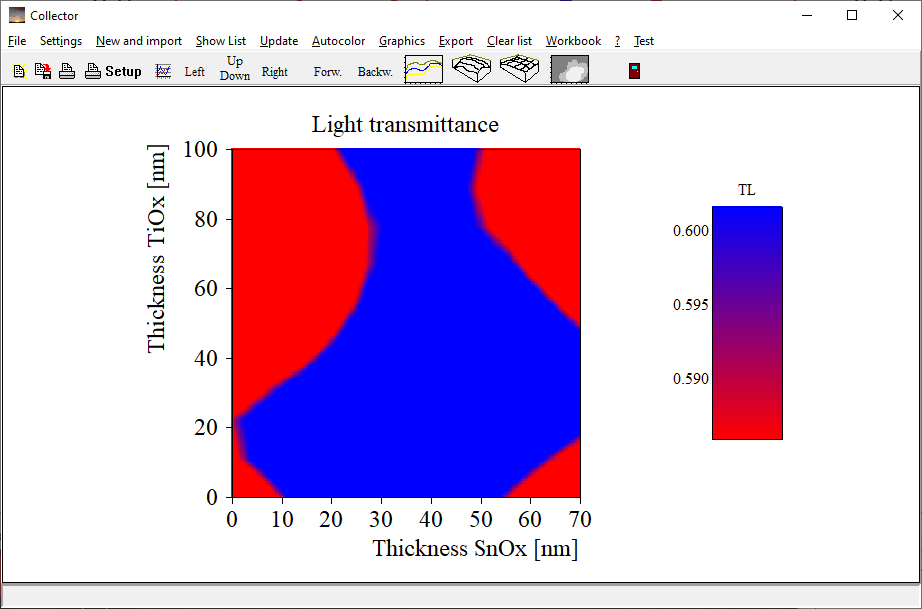
You can also select to generate false color plots which you can use to display a kind of contour graph:
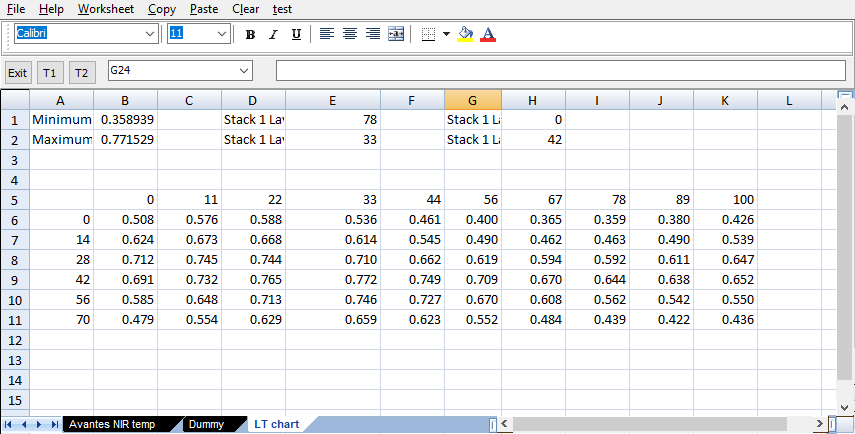
As mentioned above you have the option to store the computed data to the workbook. If your object is called ‘LT chart’ a workbook page with this name is created and the data are written to the worksheet, including minimum and maximum value as well as the position of these extrema: